Statistical Process Control (SPC) is a method used by management to identify and correct issues in the system that lead to poor quality. It involves monitoring process variations, taking corrective actions, and ensuring standards are met during production. Learn how SPC helps in reducing defects and ensuring customer satisfaction through the insights from experts like W. Edwards Deming, Joseph M. Juran, and others.
Please find below an Image/Link to download the presentation.
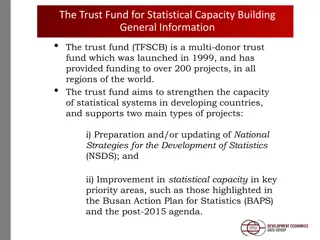
The content on the website is provided AS IS for your information and personal use only. It may not be sold, licensed, or shared on other websites without obtaining consent from the author. If you encounter any issues during the download, it is possible that the publisher has removed the file from their server.
You are allowed to download the files provided on this website for personal or commercial use, subject to the condition that they are used lawfully. All files are the property of their respective owners.
The content on the website is provided AS IS for your information and personal use only. It may not be sold, licensed, or shared on other websites without obtaining consent from the author.
What is Statistical Process Control? W. Edwards Deming The main message of Deming s 14 items list is that poor quality occurs as a result of the system and so should be corrected by the management. Deming also stressed that variation in output should be reduced by identifying particular causes that differ from random variation.
What is Statistical Process Control? Joseph M. Juran Juran was geared towards what customers want. He asserted that 80 percent of quality gaps can be corrected by management through quality planning, control, and improvement. Philip B. Crosby Introduced the concept of zero defects and stressed prevention. He pointed out that the cost of achieving higher quality also reduces costs, hence quality is free
What is Statistical Process Control? Statistical measurements, and takes corrective action while a product or service is being produced. Process Control (SPC) monitor standards, makes Samples of process outputs are examined. If they are within acceptable limits and no present discernible pattern, the process is permitted to continue. If they fall outside the specified limits or a discernible pattern is detected, the process is stopped and the assignable cause located and removed (Corrective action is taken). Acceptance sampling is used to determine acceptance or rejection of material evaluated by a sample.
What is Statistical Process Control? All processes are subject to a certain degree of variability. Walter Shewhart, in 1920s, distinguished between the common and special causes of variation. These causes are also known as natural and assignable causes of variation. A process is said to be operating in statistical control when the only source of variation is natural (common) causes.
What is Statistical Process Control? A process must first be brought to statistical control by detecting and eliminating the assignable causes of variation. Then its performance is predictable and its ability to meet customer expectations can be assessed. The objective of a process control system is to provide a statistical signal when assignable causes of variation are present.
Natural and Assignable Variations Natural Variations: Affect almost every production process and are to be expected Although individual values are different, as a group they form a pattern that can be described as a distribution. As long as the distribution output measures remain within specific limits, the process is said to be in control and natural variations are tolerated.
Natural and Assignable Variations Assignable Variations Can be traced to a specific reason. If assignable causes of variation are present, the process output is not stable over time and is not predictable. Factors such as: machine wear, misadjusted equipment, fatigued or untrained workers or new batches of raw materials are all potential sources of assignable variations.
Control Charts Control Charts are graphic presentation of data over time that show upper and lower limits for the process we want to control. Control charts are constructed in such a way that new data can be compared with past performance data. Sample of the process output are taken and the average of the samples are plotted on a chart that has the acceptable limits on it.
Samples Samples: Because of the natural and assignable causes, statistical process control uses averages of small samples (often between 4 and 8 items) Individual items tend to be too erratic to make trends quickly visible.
Samples To measure the process, we take samples and analyze the sample statistics following these steps Each of these represents one sample of five boxes of cereal (a) Samples of the product, say five boxes of cereal taken off machine line, vary from each other in weight the filling Frequency # # # # # # # # # # # # # # # # # # # # # # # # # # Weight
Samples The solid line represents the distribution (b) After enough samples are taken from a stable process, they form a pattern called a distribution Frequency Weight
Samples (c) There are many types of distributions, including the normal (bell-shaped) distribution, but distributions do differ in terms of central tendency (mean), standard deviation or variance, and shape Frequency Central tendency Variation Shape Weight Weight Weight
Samples (d) If only natural causes of variation are present, the output of a process forms a distribution that is stable over time and is predictable Frequency Prediction Weight
Samples ? ? ??? ? (e) If assignable causes are present, the process output is not stable over time and is not predicable ? ? ?????? ? ? ? ? ? Prediction Frequency Weight
Process Control (a) In statistical control and capable of producing within control limits Frequency Upper control limit (b) In statistical control but not capable of producing within control limits Lower control limit (c) Out of control Size (weight, length, speed, etc.)
Types of Data Variables Attributes Characteristics that can take any real value May be in whole or in fractional numbers Continuous random variables Defect-related characteristics Classify products as either good or bad or count defects Categorical or discrete random variables
Central Limit Theorem Regardless of the distribution of the population, the distribution of sample means drawn from the population will tend to follow a normal curve 1. The mean of the sampling distribution (x) will be the same as the population mean 2. The standard deviation of the sampling distribution ( x) will equal the population standard deviation ( ) divided by the square root of the sample size, n
Population and Sampling Distributions Three population distributions Distribution of sample means Mean of sample means = x Beta Standard deviation of the sample means = x= n Normal Uniform | | | | | | | +3 x +2 x +1 x 95.45% fall within 2 x -1 x -2 x -3 x x 99.73% of all x fall within 3 x