Learn about the T-test, a statistical method comparing two samples to determine if they are significantly different. Discover the general problem, steps for hypothesis testing, calculation methods, and an example of comparing samples.
Please find below an Image/Link to download the presentation.
The content on the website is provided AS IS for your information and personal use only. It may not be sold, licensed, or shared on other websites without obtaining consent from the author. If you encounter any issues during the download, it is possible that the publisher has removed the file from their server.
You are allowed to download the files provided on this website for personal or commercial use, subject to the condition that they are used lawfully. All files are the property of their respective owners.
The content on the website is provided AS IS for your information and personal use only. It may not be sold, licensed, or shared on other websites without obtaining consent from the author.
E N D
Presentation Transcript
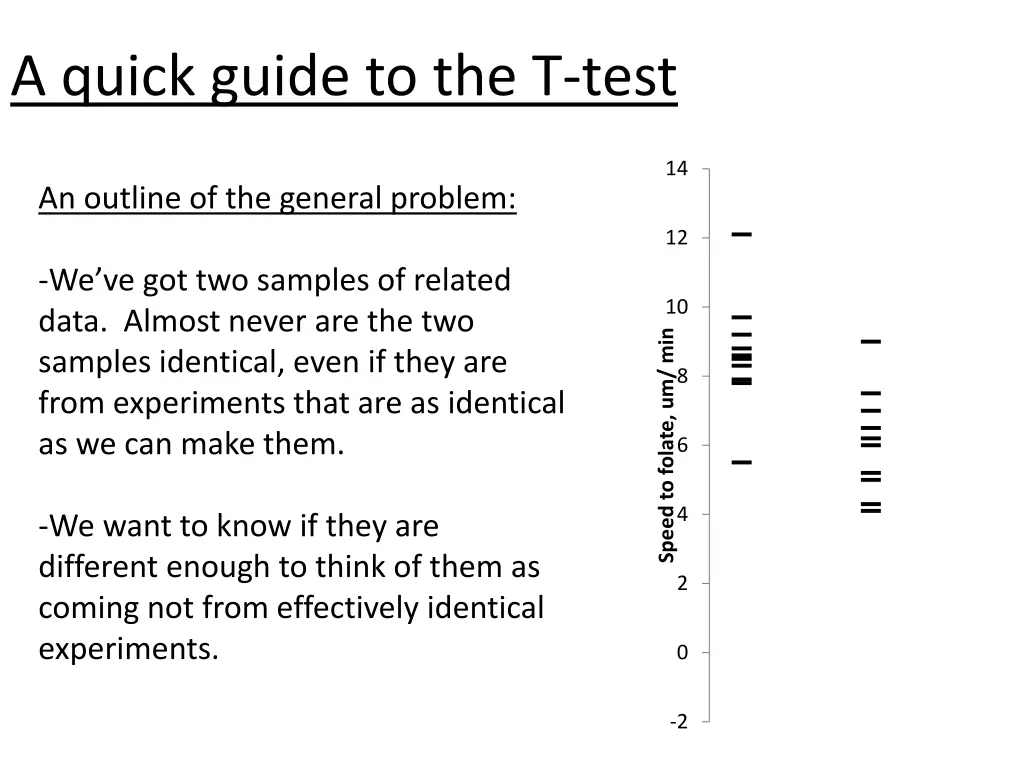
A quick guide to the T-test 14 An outline of the general problem: 12 -We ve got two samples of related data. Almost never are the two samples identical, even if they are from experiments that are as identical as we can make them. 10 Speed to folate, um/ min 8 6 4 -We want to know if they are different enough to think of them as coming not from effectively identical experiments. 2 0 -2
Terms and background Population: a big complete set of data. A sample is a small subset of a population. Mean: a measure of the center of a set of data; the average; Standard Deviation: a measure of how much a set of data vary from the mean. The variance is the square of the standard deviation. Normal Distribution: A certain bell shaped curve. When many small sources of variability are added together, the total variability tends to assume a normal distribution. and are conventionally used in stats for the mean and standard deviation of a population, respectively, while x-bar and s are used more generally. +1 st. dev., mean, value
6 Steps of any Statistical Hypothesis Testing (1) Choose a significance level, Often this is 5%. (2) Formulate a null hypothesis (expressed as an equality) and an alternative hypothesis. The alternate hypothesis can be either an one- sided (e.g., x > y) or two-sided (e.g., x y). (3) Choose a test statistic. This discussion centers on the t-statistic. (4) Compute the test statistic. (5) Compute a P-value and compare this to . (6) Draw a conclusion.
A t-test compares two samples from normally distributed populations to each other. The null hypothesis is usually that they are drawn from populations with the same mean. Our t-tests are special in 3 ways: 2 samples from populations with unequal variance data within the sets are unpaired Paired: heights of boy & girl twins at age 14. Unpaired: heights of girls in Claremont, CA & Clermont, NJ at age 14. One-sided, usually. Has to do with the your scientific hypothesis.
Calculating t-tests: two methods (1) Calculate (2) Excel. But you need to know what you re doing! C11:C20 & C1:C10 are the highlighted data ranges. 1 is for one-tailed. 3 is for unpaired with unequal variance. Then compare t to critical value at 5% cutoff and with (N1 + N2 2) degrees of freedom in table. d.f.= 18 t 0.688 1.330 1.734 2.552 P-value 0.25 0.10 0.05 0.01 This yields a P-value. If <0.05, then statistically deemed different. If >0.05, then cannot say different.
One example comparing 2 samples from one population Difference in means = 0.30 (-0.14) = 0.44 T-test P-value= 0.21 +1 st. dev. mean
Example 2 of 5 Difference in means = 0.20 (-0.58) = 0.78 T-test P-value= 0.16 0 +1 st. dev. mean
Example 3 Difference in means = 0.36 (0.34) = 0.02 T-test P-value= 0.97 0 +1 st. dev. mean
Example 4 Difference in means = -0.28 (-0.40) = 0.14 T-test P-value= 0.81 0 +1 st. dev. mean
Example 5 Difference in means = -0.30 (0.10) = -0.40 T-test P-value= 0.52 0 +1 st. dev. mean
What drives p-values? Difference in means P-value Standard Deviations 0.21 0.44 0.77 0.74 0.16 0.78 1.35 1.01 0.97 0.02 0.92 1.23 0.81 0.12 1.00 1.16 0.52 -0.40 1.79 0.69 +1 st. dev. +1 st. dev. +1 st. dev. +1 st. dev. +1 st. dev. mean mean mean mean mean
Extremes +1 st. dev. +1 st. dev. +1 st. dev. +1 st. dev. +1 st. dev. mean mean mean mean mean
Extremes We could do this quite a while longer Let s see what happens when we compare blue & yellow. +1 st. dev. +1 st. dev. +1 st. dev. +1 st. dev. +1 st. dev. mean mean mean mean mean
Extremes. Difference in means = 0.30 (-0.58) = 0.88 T-test P-value= 0.04 < 0.05 If these would have been paired random samples, then we would have rejected the null hypothesis -- the samples are from populations with the same mean. We did reject the null hypothesis even though they are samples from the same random distribution, so of course they are from populations with the same mean. 0 What gives? +1 st. dev. mean
Could these two data sets be different samples from the same experiment? 14 P = 0.001 12 Does this say that the different conditions in the experimental design led to these differences? 10 Speed to folate, um/ min 8 6 D 4 2 0 -2