Understanding the Data in the CVS Dashboard for ERASE-MM Community Vital Signs Project
Explore the data interpretation in the CVS dashboard for the ERASE-MM Community Vital Signs Project. Learn how to make sense of the data and drive actions towards health equity.

Download Presentation

Please find below an Image/Link to download the presentation.
The content on the website is provided AS IS for your information and personal use only. It may not be sold, licensed, or shared on other websites without obtaining consent from the author. If you encounter any issues during the download, it is possible that the publisher has removed the file from their server.
You are allowed to download the files provided on this website for personal or commercial use, subject to the condition that they are used lawfully. All files are the property of their respective owners.
The content on the website is provided AS IS for your information and personal use only. It may not be sold, licensed, or shared on other websites without obtaining consent from the author.
E N D
Presentation Transcript
3.1 Understanding the data in the CVS dashboard ERASE-MM Community Vital Signs Project www.erase-mm-cvsproject.org
Pathway 1. MMRC Readiness Document # Document title 1.1 1.2 Is your MMRC ready to discuss health equity? Readiness checklist 2. Overview of the Community Vital Signs Project 2.1 2.2 What is the Community Vital Signs project? What causes inequities in pregnancy related mortality? 3. Using the CVS Dashboards 3.1 3.2 3.3 3.4 Understanding the data in the CVS dashboard Interpreting the CVS dashboard CVS Dashboard Cheat Sheet Retrieving CVS dashboards 4. Using the CVS Recommendations Reference 4.1 4.2 4.3 4.4 4.5 Using the CVS Recommendations Reference Overview of CVS Recommendation Reference Recommendation reference document, Part 1 (word) Recommendation reference detail table, Part 2 (excel) RWJF County Health Rankings Roadmap and Recommendations 5. For abstractors 5.1 5.2 Using the CVS dashboard for preparing case narratives Narrative template
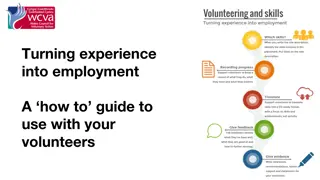
Changing the conversation: ERASE-MM Community Vital Signs Project What are some causes of inequity? Socio-spatial data indicators CVS CVS Dashboard Recommendation Evidence-based conceptual model Provide Data Link to action
Changing the conversation: ERASE-MM Community Vital Signs Project What are some causes of inequity? Socio-spatial data indicators CVS CVS Dashboard Recommendation Evidence-based conceptual model Provide Data Link to action
Risk Regulators 4. Fundamental Social Determinants Fundamental Social Determinants Spatial & Social Population Stratification Contextual & Environmental Community Environment Behavioral Health Environment Transportation Environment Reproductive Health Environment Social Support Environment General Health Environment 3. Community Context Opportunities Constraints Life course Embodiment Conception/early life Clinical Care Biomedical Kramer MR, Strahan AE, Preslar J, et al. Changing the conversation: applying a health equity framework to maternal mortality reviews. American journal of obstetrics and gynecology. 2019;221(6):609.e1-609.e9 Neuro- endocrine Health Immuno- inflammatory health Cardio metabolic health
Connecting conceptual model to data Ideal data Realized data What were the social, economic, policy, and community level opportunities and constraints that shaped each person s health prior to their death? What are the data indicators of social, economic, policy, and community level factors in the neighborhood or county in which each person lived prior to their death?
Measuring Community Vital Signs Selecting indicators and acquiring measures
How were socio-spatial indicators chosen? Candidate indicators had to meet the following criteria: 1. Indicators derived from conceptual model and literature review of maternal health Measures of supply of health-relevant resources Measures of demands for health-relevant resources Measure of socio-contextual environment 2. Indicator is reliably measured for all geographic units (e.g. county, census tract) across all states 3. Indicator is publicly available
What indicators are in the CVS dashboard? General Health Service Environment Behavioral Health Service Environment Reproductive Health Service Environment Socio Economic Environment Transportation Environment Mental health provider per 100,000 % households without car PCPs per 100,000 Poverty OB-GYNs per 100,000 Mental health practice per 100,000 Rural/urban status Violent crime rate % CNMs per 100,000 uninsured Opioid Unstable housing Obesity prevalence prescription rate Chlamydia rate Racial & economic segregation Drug overdose death rate % poor/fair health % LBW Racialized poverty Food insecurity Teen birth rate
What are the geographic and time scale of socio-spatial measures? Geography Time of measures Measures are captured at either County or county equivalent Census tract as proxy for neighborhood Many measures are updated annually The CVS Project has indicators from 2010-2020 and plans continued updates
What is the source for these data indicators? Datasets URL Area Resource Health File: https://data.hrsa.gov/data/download American Community Service: https://data.census.gov/cedsci/ Robert Wood Johnson County Health Ranking: http://www.countyhealthrankings.org/ EPA Smart Location Database: https://www.epa.gov/smartgrowth/smart- location-mapping#SLD SAMHSA/NSDUH: https://www.samhsa.gov/data/population-data- nsduh/reports?tab=38
What is the evidence for association with maternal mortality? Analysis of 4,094 pregnancy related deaths from 2011-2016 Pregnancy Mortality Surveillance System Evaluate county socio-spatial indicators with pregnancy related mortality for non- Hispanic White, Black and Hispanic pregnant people Barrera CM, Kramer MR, Merkt PT, et al. County- Level Associations Between Pregnancy-Related Mortality Ratios and Contextual Sociospatial Indicators. Obstetrics & Gynecology. 2022 Click link to download free version of this paper.
Barrera, et al, Obstetrics & Gynecology, 2022 Indicators most closely associated with fewer pregnancy-related deaths* Indicators most closely associated with excess pregnancy-related deaths* Higher median household income Higher percent college graduates Higher percent owner-occupied households Percent low birthweight infants Unemployment rate Percent with food insecurity *The magnitude of these associations varied by race and ethnicity.
Conclusion 1. Socio-spatial indicators on CVS dashboards are selected to measure the community environment and context in which the decedent lived 2. Socio-spatial indicators selected based on literature, theory, and empirical evidence 3. Socio-spatial indicators will be re-evaluated and updated as evidence base grows
Acknowledgements The Community Vital Signs Project was developed by a team at Emory University with support from Centers for Disease Control and Prevention, Division of Reproductive Health Maternal Mortality Prevention Team Emory Team Michael Kramer (PI) Sarah Blake Autumn Watson Marissa Coloske CDC Team David Goodman Julie Zaharatos Toby Merkt Please use the Contact link at https://erase-mm-cvsproject.org to provide any feedback or ask questions This presentation was prepared by Michael Kramer