Understanding the Impact of Madden-Julian Oscillation on Severe Weather Synoptic Conditions
Explore the influence of the Madden-Julian Oscillation (MJO) on severe weather synoptic conditions, focusing on its planetary-scale wind and convection patterns. Discover how MJO phases can affect mid-latitude flow and lead to Rossby wave trains that influence weather events. Learn about the methodology used to analyze MJO events and assess synoptic conditions surrounding them. Gain insights into how MJO can aid in medium-range forecasting skills and enhance understanding of weather systems.
Download Presentation

Please find below an Image/Link to download the presentation.
The content on the website is provided AS IS for your information and personal use only. It may not be sold, licensed, or shared on other websites without obtaining consent from the author. If you encounter any issues during the download, it is possible that the publisher has removed the file from their server.
You are allowed to download the files provided on this website for personal or commercial use, subject to the condition that they are used lawfully. All files are the property of their respective owners.
The content on the website is provided AS IS for your information and personal use only. It may not be sold, licensed, or shared on other websites without obtaining consent from the author.
E N D
Presentation Transcript
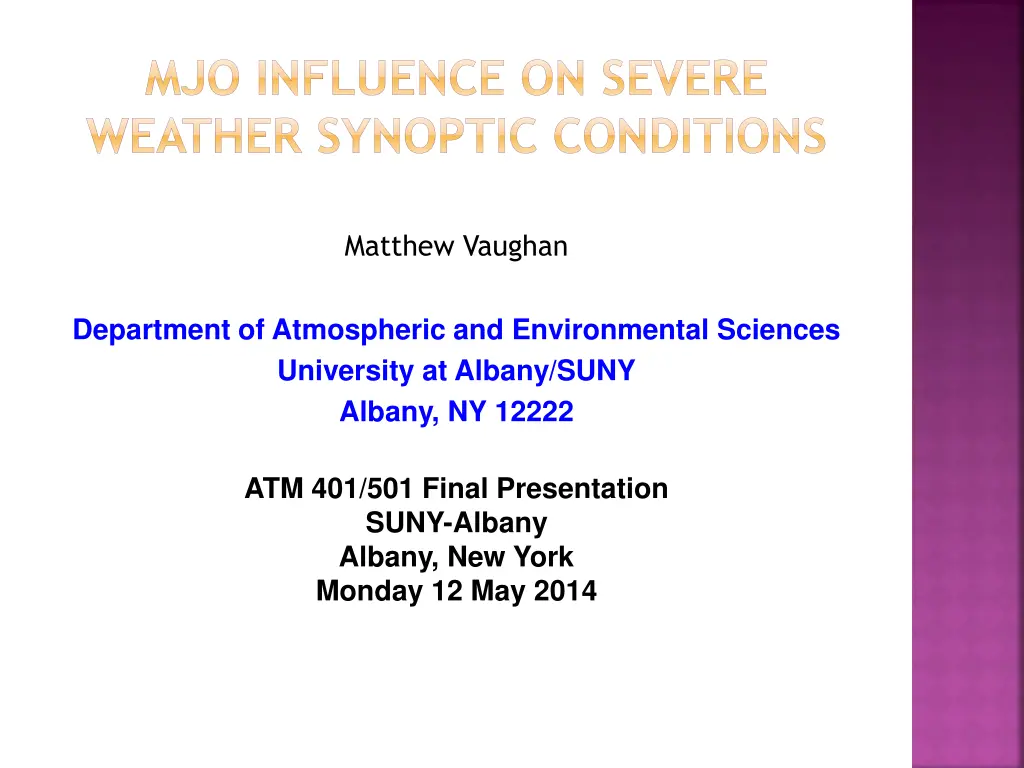
MJO INFLUENCE ON SEVERE WEATHER SYNOPTIC CONDITIONS Matthew Vaughan Department of Atmospheric and Environmental Sciences University at Albany/SUNY Albany, NY 12222 ATM 401/501 Final Presentation SUNY-Albany Albany, New York Monday 12 May 2014
BACKGROUND Madden-Julian Oscillation (MJO) is a planetary-scale pattern of winds and convection that propagates eastward Tropical convection can generate Rossby wave trains that influence mid-latitude flow as they propagate towards the poles (Sardeshmukh and Hoskins 1988)
MOTIVATION 1974-2010 (all year) Thompson and Roundy (2012) Fraction of days categorized as VTDs by RMM phase >1.0 amplitude (solid bars). Periods when RMM amplitude was <1 appear in the <1 bar, and the full climatology appears in the All bar. Clear bars and lines within the solid bars together represent the 90% confidence interval obtained from a Monte Carlo test.
MOTIVATION 1974-2010 (March, April, and May) Thompson and Roundy (2012) Fraction of days categorized as VTDs by RMM phase >1.0 amplitude (solid bars). Periods when RMM amplitude was <1 appear in the <1 bar, and the full climatology appears in the All bar. Clear bars and lines within the solid bars together represent the 90% confidence interval obtained from a Monte Carlo test.
MOTIVATION Aid in medium range forecasting skill for convection in the Eastern CONUS MJO lead times of 14-17 days demonstrated by Maharaj and Wheeler (2005).
METHODOLOGY MJO phase determined by Real- time Multivariate MJO (RMM) index (Wheeler and Hendon 2004) Dataset consists of phase-2 MJO events between 2003-2013 with an RMM amplitude >1
METHODOLOGY Build composite mean and anomaly charts to assess synoptic conditions surrounding phase- 2 MJO events using NOAA/ESRL software Examine days leading up to during, and after the onset of phase-2 MJO event.
RESULTS 16 MJO phase-2 events occurred between 2003-2013 during March, April, and May (MAM) with an RMM amplitude >1 11 events met the criteria for inclusion based on ENSO conditions
RESULTS a.) b.) c.) Composite 300-hPa geopotential height anomaly (contour interval of 20 m with warm colors positive and cool colors negative) Time lags of (a) -7, (b) -3, (c) 0, days until the onset of the MJO.
DAY +1 a.) b.) c.) Composite (a) 500-hPa geopotential height anomaly (interval of 20 m), (b) 850-hPa geopotential height anomaly (interval of 10 m), and (c) columnar precipitable water anomaly (interval of 1 kg/m2)
DAY +3 a.) b.) c.) Composite (a) 500-hPa geopotential height anomaly (interval of 20 m), (b) 850-hPa geopotential height anomaly (interval of 10 m), and (c) columnar precipitable water anomaly (interval of 1 kg/m2)
DAY +5 a.) b.) c.) Composite (a) 500-hPa geopotential height anomaly (interval of 20 m), (b) 850-hPa geopotential height anomaly (interval of 10 m), and (c) columnar precipitable water anomaly (interval of 1 kg/m2)
CONCLUSION MJO is an important teleconnection feature for mid-latitude weather patterns Results suggest Eastern US has more favorable synoptic precursors to severe weather during MAM phase-2 MJO MJO-factor can influence medium-range forecasts
DAY +7 a.) b.) Composite (a) 500-hPa geopotential height anomaly (interval of 20 m), (b) 850-hPa geopotential height anomaly (interval of 10 m).


