Understanding the Impact of Public Works on Emergency Management and Infrastructure Resilience
Explore the critical role of public works in emergency management, infrastructure resilience, and disaster mitigation efforts as outlined by the APWA. Learn about key policies, priorities, and initiatives shaping public works in the United States and Canada.
Download Presentation

Please find below an Image/Link to download the presentation.
The content on the website is provided AS IS for your information and personal use only. It may not be sold, licensed, or shared on other websites without obtaining consent from the author. If you encounter any issues during the download, it is possible that the publisher has removed the file from their server.
You are allowed to download the files provided on this website for personal or commercial use, subject to the condition that they are used lawfully. All files are the property of their respective owners.
The content on the website is provided AS IS for your information and personal use only. It may not be sold, licensed, or shared on other websites without obtaining consent from the author.
E N D
Presentation Transcript
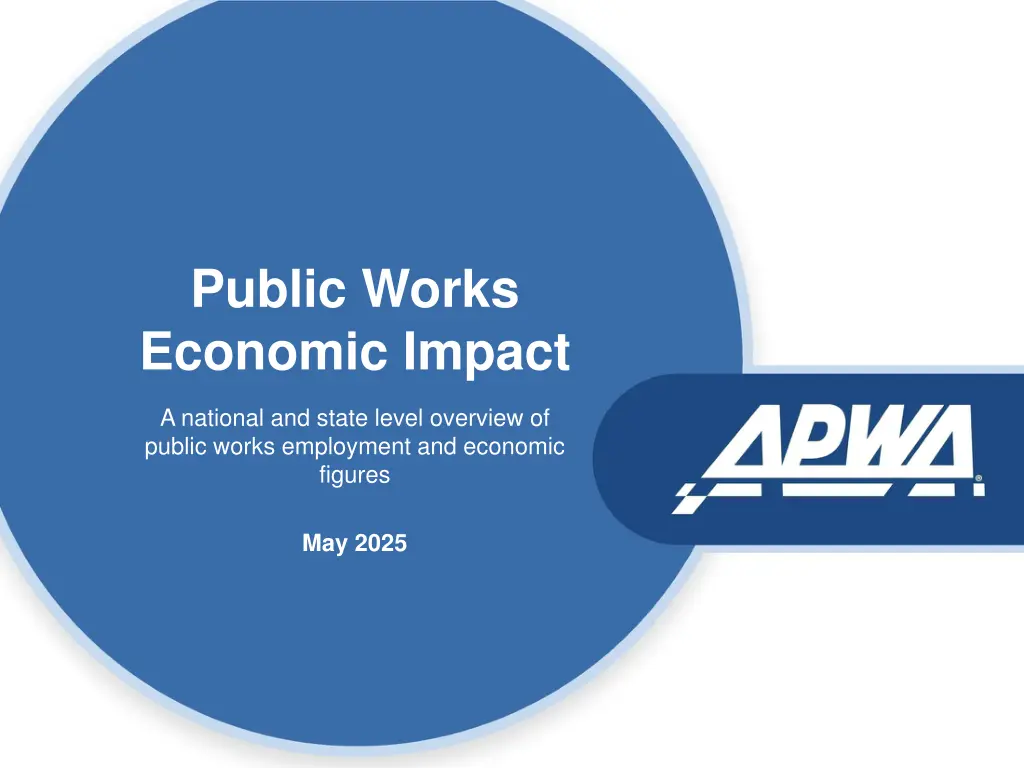
Public Works Economic Impact A national and state level overview of public works employment and economic figures May 2025
What is Public Works? DEFINITION: Public works is the combination of physical assets, management practices, policies, and personnel necessary for government to provide and sustain structures and services essential to the welfare and acceptable quality of life for its citizens The United States has approximately 19,400 municipalities of varying sizes, and Canada is home to nearly 3,700 more. In each community, whatever its size, there are needs common to all human beings that must be met through the provision of public works services. These needs are met on a daily basis by visionary, values-driven, and hardworking men and women who provide and sustain public works services in the best interests of their communities Sources: APWA
APWAs Public Policy Priorities for the 119th Congress: Emergency Management Transportation Water Resiliency Sources: APWA Every two years to align with the U.S. Congressional cycle, APWA reviews and updates its Public Policy Priorities
APWA Priorities for Emergency Management Emergency Management Planning: Public works is critical in emergency planning, responding to, and recovering from infrastructure impacts from natural and man- made disasters. Furthermore, in 2003 with the enactment of Homeland Security Presidential Directive (HSPD)- 8, public works was recognized as first responders. Mitigation: Pre- and post-disaster mitigation are essential to protect against physical and financial harm. More than 750 Major Disaster and Emergency Disaster Declarations for states and counties recorded by the Federal Emergency Management Agency (FEMA) since 2020. APWA advocates for federal emphasis on mitigation through grants and training opportunities to assist in hardening our nation in preparing for disasters. Continue funding the Building Resilient Infrastructure Communities (BRIC), Flood Mitigation Assistance (FMA), and the Hazard Mitigation Grant Program (HMGP), which provide grants to states and local governments to implement long-term hazard mitigation projects. Communication & Coordination: Efficient and operational communication among public works professionals and other first responders is required for effective preparedness, response, and recovery operations. As first responders, public works professionals must be included when developing, implementing, and executing cybersecurity and telecommunication policies and programs, such as the First Responder Network Authority, or FirstNet. Streamlining: During the 118th Session of Congress, APWA advocated for the passage of S. 3648, the Helping Eliminate Limitations for Prompt Response and Recovery Act , which would repeal Section 695 of the Post-Katrina Emergency Management Reform Act of 2006 and it would restrict the length of non-competitive DHS contracts for urgent and compelling requirements to 150 days. Removing Section 695 would ensure that DHS deadlines for emergency contracts follow current government-wide rules that allow contracts of up to one-year. APWA argues that by granting agencies additional time to better vet their submissions for funding and providing the required paperwork simultaneously reducing the need for supplemental information at, or near, the deadline that often imperils the awarding of funds. Cybersecurity & Telecommunication:In 2023, APWA premiered Foundational Cybersecurity Concepts for Public Works Professionals . This course, developed with input from federal partners, including the Cybersecurity Infrastructure and Security Agency (CISA), ensures that public works professionals are better able to avoid, react to, and anticipate cyber threats. This course emphasizes the importance of preparing APWA members for the ever evolving and ever present cybersecurity challenges. Priority Planning/Recommendations: Ensure federal training programs designed to enhance interagency cooperation in emergency management includes public works response aspects, and actively seek public works participation in design and attendance. APWA strongly encourages the Federal Emergency Management Agency (FEMA) to work with local, state, and tribal governments to ensure a Public Assistance (PA) deductible can be properly drafted and meet unique population needs. Sources: APWA Language comes directly from APWA 119th Emergency Management Priorities
Economic Impact of Emergency Management OVERVIEW FAST FACTS 60 Number of disasters requiring a major or emergency declaration The Emergency Management Performance Grant (EMPG) program is the only source of federal funding provided directly to state and local governments for the functions which help build robust emergency management systems EMPG funding has supported 2,322 statewide preparedness outreach campaigns and 7,216 local campaigns At least 2,729 state and 2,372 local plans were developed, maintained, or updated using EMPG funds In 2023, the United States dealt with 100+ disaster events, causing losses of $28B For every $7 spent on disaster recovery, only about $1 is spent on resilience against future hazards Every $1 spent on resilience has an estimated economic benefit of $7 The United States federal government spends approximately $46 billion a year on disaster response and just 1/7th ($7 billion) to develop resilience for the next disaster AIR, a leading catastrophe modeling firm, reports that the value of coastal exposures in the U.S. grew 27% between 2012 and 2018 A National Institute of Buildings Sciences report highlights that the country could cost-effectively spend $520 billion to reduce its disaster liability by $2.2 trillion 23,910 Events requiring state assets that did not reach the level of a major declaration 3,319 Additional events using local assets funded by the EMPG program 108.2 million People reached by preparedness outreach campaigns in 2023 $700 million+ Return on investment in Emergency Management Performance Grant program Sources: International Association of Emergency Management, Brookings, National Institute of Building Sciences , FEMA, National Conference of State Legislators Research and data comes from the International Association of Emergency Managers 2024 report, the 2021 Brookings Report on emergency management, the 2020 National Institute of Building Sciences report on resilience, the 2024 NCSL report on disaster resilience, and 2023 FEMA statistics
Economic Impact of Emergency Management Figure 1 Figure 2 Federal Disaster Response Appropriated Funding by Agency DHS-FEMA Funding Disaster Assistance Direct Loan Program Account Community Disaster Loans, 1% SBA, 1% USDA, 6% DHS (w/o FEMA), 1% Disaster Relief Fund Administration, 20% HUD, 27% Disaster Relief Fund Public Assistance, 45% Disaster Relief Fund Individual Assistance, 18% HHS, 1% DHS-FEMA, 43% ED, 2% DOT, 2% DOI, 1% DOD-USACE, 13% Disaster Relief Fund Operations, 14% Disaster Relief Fund Mitigation, 2% DOD (w/o USACE), 2% DOC, 1% Sources: Brookings, FEMA Figure 1 comes from FEMA, last updated April 2025. The most up-to-date appropriations data is from 2017-2019 disasters. Figure 2 comes from Brookings, last updated in 2021
Annual Appropriations to the Disaster Relief Fund (DRF) Annual DRF appropriations through the normal budgeting process are small and the unpredictable nature of large-scale disasters means that a large majority of DRF funds come from supplemental appropriations As DRF appropriations are simply an amount of budget authority provided to support disaster activities, many of the issues related to the DRF are less about the appropriation than they are about the defined federal role in disaster relief operations Disaster Relief Appropriations, FY1994-FY2021 (billions) $80 $70 $60 $50 $40 $30 $20 $10 $0 1994 1997 2000 2003 2006 2009 2012 2015 2018 2021 Annual Appropriations Supplemental Appropriations Sources: Congressional Research Service Research and data comes the Congressional Research Service Disaster Relief Fund Report last updated in 2024
APWA Priorities for Transportation Transportation Safety: APWA supports IIJA s increased investment in pre-existing safety programs, and its establishment of new programs with a significant safety component. Additionally, APWA backs transportation programs supporting safety improvements to local and rural roads, work zones, traffic incident management practices, public transit, railroads and railroad crossings. APWA strongly encourages the greatest possible flexibility and accommodation to local entities and in support of safety projects, including continuing to streamline permitting, reporting and other project requirements, and require states to utilize federal fund exchange programs with their local governments. APWA also supports the ability to combine program funds on projects, e.g., railroad crossing and Highway Safety Improvement Program (HSIP) funding to increase efficient use of tax dollars. APWA is focused on ensuring safety related transportation programs are fully funded and information is widely disseminated for maximum impact on improving the safety of our transportation network. Continue Streamlining Success: The infrastructure law takes important steps to continue responsible streamlining of regulatory requirements and permitting processes to protect the environment and distribute funding. Ensuring all communities especially small, rural, and historically disadvantaged can access the investment opportunities of the law, it is essential that these communities have direct access to technical experts and can leverage resources to assist in streamlining infrastructure processes and permitting. Local governments must have a seat at the table and be fully engaged in rulemaking and permitting processes as they have the best understanding of their community needs and the impact. Infrastructure Resilience: APWA supports an approach that incentivizes resiliency measures in infrastructure planning and design, the development of tools to build more resilient transportation systems and encourages continual focus on present and future usage. APWA also supports building upon the law s investment opportunities for local entities to directly apply to grant programs that can be used to complete major infrastructure upgrades and assist communities of all sizes and diverse needs in improving resiliency, safety, and economic opportunity. Furthermore, APWA supports the use of municipal bonds and restoring the ability for state and local governments to issue tax-exempt advance refunding bonds in lowering the total cost of bond funded infrastructure. Sources: APWA Language comes directly from APWA 119th Transportation Priorities
Economic Impact of Public Transportation $1 invested in public transportation returns $5 in economic benefits T he average household spends 16% of income on transportation, and 93% of this goes to buying, maintaining, and operating cars The average household can save nearly $13,000 by replacing a personal vehicle with use of public transit over the average operational lifespan of a vehicle after purchase Every $1 billion invested in public transportation supports and creates approximately 50,000 jobs 87% of trips on public transit have a direct impact on the local economy Home values in areas near public transport were up to 24% higher than in other areas Hotels in cities with direct rail access to airports raise 11% more revenue per room than hotels in cities without direct rail Per $Billion of Operations Investment Per $Billion of Average Investment Economic Impact Per $Billion of Capital Investment Output (business sales) $2.6 billion $3.0 billion $2.9 billion GDP (value added) $1.2 billion $1.9 billion $1.8 billion Labor Income $0.8 billion $1.3 billion $1.2 billion Tax Revenue (fed, state, local) $264 million $428 million $382 million Jobs (employment) 12,600 20,000 17,900 (includes direct, supplier purchases, and employee spending, 2018 $s) Sources: American Public Transportation Association Research and data comes from the American Public Transportation Association Report and Fact Sheet last updated in 2020 and 2023, respectively
APWA Priorities for Water Resiliency Water Resiliency Resilience and Stewardship: APWA supports ensuring flexibility and funding levels meet the need for replacing lead service lines. Support targeted improvements for water systems for natural hazards, cybersecurity vulnerabilities, or extreme weather events by fully funding: Midsize and Large Drinking Water System Resilience and Sustainability Program and Clean Water Infrastructure Resiliency and Sustainability Program. Support is crucial for programs such as the Water SMART Drought Response Program, which assists state, local, tribal, and critical service entities with drought-related activities and expands the technology transfer of drought and water conservation strategies. APWA also supports federal coordination on regional preparedness planning to mitigate the impacts of water scarcity and flooding. The National Water Reuse Action Plan should guide future water policy, and incentives are needed to strengthen asset management and reverse infrastructure decline. Flexibility and resources should also be provided for communities working to rehabilitate or remove aging dams that benefit safety and the environment. Update: Public works professionals are on the front lines of addressing emerging contaminants, such as per- and polyfluoroalkyl substances (PFAS), and must be included in ongoing discussions with regulators and other stakeholders to ensure policies are grounded in safety and science. APWA supports regulatory standards that are informed by thorough research, peer-reviewed studies, and comprehensive cost-benefit analysis. A time-sensitive waiver process for Buy America provisions would provide clarity and relief from current supply chain disruptions. Full funding is needed for agencies to hire appropriately trained staff, allocate resources for outreach, and provide technical assistance to applicants. APWA also encourages the EPA to advance integrated planning approaches across water permitting programs, promote coordinated water management strategies within regulatory and grant frameworks, and utilize comprehensive data and analysis in program development. Additionally, enhancing financing mechanisms for infrastructure investment should remain a priority. Streamline: Adhere to the One Federal Decision process, which IIJA and the Fiscal Responsibility Act codified into law to provide a more predictable, transparent, and timely federal review and authorization process for projects. When revising regulations for streamlining, retaining analyses such as cumulative impacts to account for maximum cost benefit analysis and environmental impacts. APWA strongly encourages the federal government and industry to coordinate with state and local governments on water infrastructure projects. APWA opposes unfunded mandates. APWA opposes curtailing the local governing authorities ability to appropriately control use of public rights-of-way. PWA also supports allowing states with more stringent regulations to use their processes to demonstrate compliance with national standards and removing arbitrary litigation windows that delay progress. Streamlining should also reduce barriers in the SRF application process, particularly excessive financial requirements that discourage participation. A fast-track or partial waiver process should be considered for smaller projects those under $5 million or using minimal federal funds to ease regulatory burdens such as environmental assessments. Sources: APWA Language comes directly from APWA 119th Water Resiliency Priorities
Economic Impact of Water Resiliency OVERVIEW FAST FACTS 2.1 trillion Gallons of drinking water lost as a result of aging infrastructure in U.S. Globally, more than 2 billion people live in highly water-stressed countries, and about 4 billion people experience severe water scarcity for at least one month of the year An estimated 80% of the world s wastewater is released untreated into the environment, polluting water resources faster than nature can recycle and purify them Since 1990, water-related catastrophes have accounted for almost 90 percent of the top thousand most devastating natural disasters According to the U.S. Water Alliance, the U.S. needs to invest a total of $109 billion per year in water infrastructure over the next 20 years to close the water infrastructure gap Total capital spending on water infrastructure (including O&M) at the local, state, and federal levels is projected at $179 billion in 2024 while investment needs are estimated at $270 billion, creating a $91 billion-dollar gap for 2024 alone If trends continue, the capital investment needed for water infrastructure repairs and improvements over the next 20 years will total $6.59 trillion Underinvestment would lead to a cumulative $1.75 trillion decline in GDP by 2043 By continuing to invest at IIJA spending levels, the investment gap could be reduced by $125 billion in the next two decades Sustaining IIJA funding levels for the next two decades will yield substantial benefits including reduced economic losses, reduced healthcare costs, improved resilience for water-reliant industries, more savings for households, and long-term economic growth $452 billion Estimated cost of replacing the nation s aging water infrastructure $7.6 billion Cost of lost water in 2019 due to leaks from poor infrastructure in U.S. 675,000 Jobs lost annually by 2043 as a result of lower production volumes 89,000 Expected U.S. manufacturing job losses by 2039 as a result of unreliable water services Sources: U.S. Water Alliance, American Society of Civil Engineers Research and data comes from the U.S. Water Alliance report, last updated in 2020, and the American Society of Civil Engineers 2024 report
Economic Benefits of Water Infrastructure Investment Should the United States increase its investment in water infrastructure by $2.2 trillion over the next 20 years, or roughly $109 billion per year, business sales would increase by $5.6 trillion, growing the U.S. GDP by $4.5 trillion; upwards of 800,000 jobs could be created, with wages increasing disposable income by over $2,000 per household; and the trade balance would be improved as U.S. exports would become more competitive, gaining $225 billion in export value Increased reliability in water services would help U.S. households save up to $6,745 each over the next two decades, decrease service disruptions to water-reliant businesses, resulting in cost savings of 46%, and save $362 billion cumulative disposable income losses Investment impact on jobs Investment impacts on economy 0K Disposable Income GDP Output -100K $0 -200K -$1,000 Economic Impact ($ billion) -300K -$1,219 -$2,000 -$1,779 -400K -$1,581 -$3,000 -$2,437 Thousands of Jobs -500K -472K -$4,000 -600K -$3,661 -$5,000 -700K -675K -$4,997 -800K -$6,000 Failure to Act Scenario 2043 Continue to Invest Scenario 2043 Sources: U.S. Water Alliance, American Society of Civil Engineers Research and data comes from the U.S. Water Alliance report last updated in 2020 and the American Society of Civil Engineers 2024 report
Workforce Development APWA supports federal policies and dedicated, full funding for workforce programs that ensure a pipeline of public works professionals well into the future. Public works faces serious challenges: an aging workforce, the growing gap in technical expertise and trade skills, and a lack of awareness about public works careers. As the leader in public works education and credentialing programs, APWA encourages and values continual education and professional growth opportunities for those who build, operate, and maintain our nation s infrastructure APWA successfully advocated for the inclusion of a definition of public works department within IIJA Critical step in recognizing public works and the vitality of a strong workforce to support it IIJA Text Sources: APWA Language comes directly from APWA

