Understanding the Sleep-Feeding Conflict in Fruit Flies
Explore the research on the relationship between sleep and feeding in Drosophila melanogaster (fruit flies) to uncover insights into their behavior and survival strategies. Utilizing the Drosophila Sleep Inbred Panel (SIP) lines, the study investigates whether the duration of sleep affects food intake in fruit flies.
Download Presentation

Please find below an Image/Link to download the presentation.
The content on the website is provided AS IS for your information and personal use only. It may not be sold, licensed, or shared on other websites without obtaining consent from the author. If you encounter any issues during the download, it is possible that the publisher has removed the file from their server.
You are allowed to download the files provided on this website for personal or commercial use, subject to the condition that they are used lawfully. All files are the property of their respective owners.
The content on the website is provided AS IS for your information and personal use only. It may not be sold, licensed, or shared on other websites without obtaining consent from the author.
E N D
Presentation Transcript
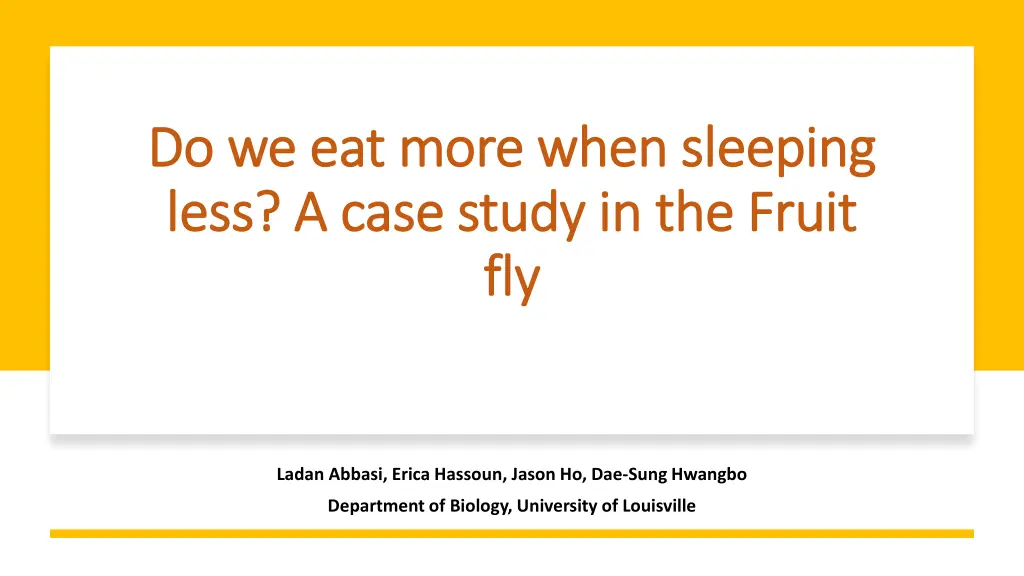
Do we eat more when sleeping Do we eat more when sleeping less? A case study in the Fruit less? A case study in the Fruit fly fly Ladan Abbasi, Erica Hassoun, Jason Ho, Dae-Sung Hwangbo Department of Biology, University of Louisville
Introduction Introduction
Sleep Sleep- -feeding conflict feeding conflict Sleep and feeding are two mutually exclusive behaviors. At any given time, individual can either sleep or feed. Both behaviors are important for survival, yet a tight balance between them is crucial for survival.
Hypothesis Hypothesis We were interested to know more about sleep-feeding conflict using Drosophila melanogaster (fruit fly) as a model organism. Research Question: Do we see a negative correlation between sleep and feeding in fruit flies? To answer the question, we took advantage of Drosophila Sleep Inbred Panel (SIP) lines that are artificially selected for short or long sleep and measured their food consumption. Hypothesis: long-sleep flies have less food intake and short-sleep flies have high food intake.
Method Method
MEASURING SLEEP: MEASURING SLEEP: DROSOPHILA ACTIVITY DROSOPHILA ACTIVITY MONITOR MONITOR The Drosophila Activity Monitor (DAM) system, (TriKinetics, Waltham, MA), is a set of devices for recording Drosophila locomotor behavior that is widely used around the world. The DAM system records infrared beam breaks of flies walking in glass tubes. Each DAM monitor has 32 channels recording locomotor behavior of individual flies. With many monitors used in an experiment, hundreds of individuals can be tracked simultaneously. The tubes housing flies during an experiment contain fly food, allowing monitoring of behavior over many days or even weeks (Cichewicz&Harish,2018).
MEASURING FOOD CONSUMPTION: CONSUMPTION-EXCRETION ASSAY In consumption-excretion method, flies consume solid food labeled with a blue dye, and the volume of food consumed is reflected by the sum of the dye inside of and excreted by flies (shell BC. et al, 2018).
Experimental design Experimental design Food consumption We used 37 SIP lines, male only, a sample size of 555. Measured food consumption after 48 hours using con-ex method. Sleep 37 SIP lines, male only, a sample size of 592 at a single-fly resolution. Recorded sleep over a 24h window using DAM system.
Results Results
Sleep pattern in SIP lines Sleep pattern in SIP lines 200 150 100 75 ABL L1-02 100 % Sleep L2-01 50 50 S2-06 25 S1-09 0 0 S2-06 S2-03 S1-02 S1-09 S2-07 S1-04 S2-10 S2-04 S1-01 S1-03 S1-08 S1-07 S2-02 S2-09 S1-05 S1-06 S2-05 S2-08 S1-10 L1-07 L2-05 Lines L2-02 L2-01 L1-05 L1-03 L2-04 L2-07 L1-06 L1-02 L1-04 L1-09 L1-01 L1-08 L2-10 L1-10 L2-06 L2-08 0 12 24 Long sleeper Short sleeper
Food intake in SIP lines Food intake in SIP lines 0.400 Food Intake (48hrs) Food Intake (48 hrs) 0.350 0.300 0.300 0.250 0.250 O.D. 0.200 0.200 0.150 O.D. 0.150 0.100 0.100 0.050 0.050 0.000 S1-01 S2-02 S1-09 S2-07 S2-05 S2-03 S1-05 S1-03 S2-04 S1-06 S1-08 S2-10 S2-09 S2-08 S1-10 S2-06 S1-04 S1-07 S1-02 L2-06 L2-07 L2-08 L2-01 L2-10 L1-07 L1-01 L2-05 L1-04 L1-10 L1-06 L2-04 L1-05 L2-02 L1-02 L1-08 L1-03 Lines L1-09 0.000 L1 L2 S1 S2 Long sleeper Short sleeper
Inverse sleep Inverse sleep- -feeding correlation feeding correlation Sleep Length vs Food Intake 200 0.40 160 Sleep Length (ABL, min) 0.35 Sleep Length Food Intake 140 150 0.30 120 ABL (min.) 0.25 100 O.D. 100 0.20 80 0.15 60 50 0.10 40 0.05 20 0 0.00 0 S2-06 S2-03 S1-02 S1-09 S2-07 S1-04 S2-10 S2-04 S1-01 S1-03 S1-08 S1-07 S2-02 S2-09 S1-05 S1-06 S2-05 S2-08 L1-07 L2-05 L2-02 L2-01 L1-05 L1-03 L2-04 L2-07 L1-06 L1-02 L1-04 L1-09 L1-01 L1-08 L2-10 L1-10 L2-06 0.00 0.10 0.20 0.30 Food Intake (0.D.) Lines Pearson s coefficient -0.648447057 p value 0.00003
Discussion Discussion
Our results confirm short and long sleep phenotypes in SIP lines. a negative correlation between sleep and feeding where long sleepers eat less and short sleepers eat more. Under optimal conditions, foraging and sleep are balanced allowing individuals to survive. A deviation from this balance may be detrimental. Future experiments: Looking at lifespan of SLP lines. Analyzing starvation resistance of SLP lines. Ultimately, figuring out the neurocircuits involved in sleep-feeding regulation.
Acknowledgment Acknowledgment My PI: Dr. Dae-Sung Hwangbo Undergraduate students: Erica Hassoun Jason Ho University of Louisville


