Understanding the Term Structure of Interest Rates
Explore the concept of the term structure of interest rates, including the yield curve, bond pricing, and valuing coupon bonds. Learn how to interpret the relationship between yields and time to maturity, and delve into theories such as the expectation hypothesis and liquidity preference. Gain insights into using spot rates for pricing coupon bonds and examining treasury yield curves.

Download Presentation

Please find below an Image/Link to download the presentation.
The content on the website is provided AS IS for your information and personal use only. It may not be sold, licensed, or shared on other websites without obtaining consent from the author. If you encounter any issues during the download, it is possible that the publisher has removed the file from their server.
You are allowed to download the files provided on this website for personal or commercial use, subject to the condition that they are used lawfully. All files are the property of their respective owners.
The content on the website is provided AS IS for your information and personal use only. It may not be sold, licensed, or shared on other websites without obtaining consent from the author.
E N D
Presentation Transcript
Chapter Fifteen The Term Structure of Interest Rates INVESTMENTS | BODIE, KANE, MARCUS
Chapter Overview The yield curve Interest rates under certainty Interest rates under uncertainty Theories of the term structure The expectation hypothesis Liquidity preference Interpreting the term structure INVESTMENTS | BODIE, KANE, MARCUS 15-2
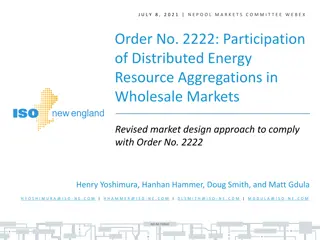
The Yield Curve The yield curve is a graph that displays the relationship between YTM and time to maturity https://www.gurufocus.com/yield_curve.php Information on expected future short-term rates can be implied from the yield curve INVESTMENTS | BODIE, KANE, MARCUS 15-3
Figure 15.1 Treasury Yield Curves INVESTMENTS | BODIE, KANE, MARCUS 15-4
Yield Curve: Bond Pricing Yields on different maturity bonds are not all equal We need to consider each bond cash flow as a stand-alone zero-coupon bond The value of the bond should be the sum of the values of its parts INVESTMENTS | BODIE, KANE, MARCUS 15-5
Table 15.1 Prices and Yields to Maturities on Zero-Coupon Bonds ($1,000 Face Value) INVESTMENTS | BODIE, KANE, MARCUS 15-6
Example 15.1 Valuing Coupon Bonds Value a 3 year, 10% coupon bond using discount rates from Table 15.1: 100 $ 100 $ 1100 $ = + + Price 2 3 . 1 05 . 1 06 . 1 07 Price = $1082.17 and YTM = 6.88% 6.88% is less than the 3-year rate of 7% INVESTMENTS | BODIE, KANE, MARCUS 15-7
Using Spot Rates to Price Coupon Bonds A coupon bond can be viewed as a series of zero coupon bonds. To find the value each payment is discount at the zero coupon rate. Once the bond value is found, one can solve for the yield. It s the reason that similar maturity and default risk bonds sell at different yields to maturity. INVESTMENTS | BODIE, KANE, MARCUS 15-8
Sample Bonds A B 4 years 8% 1,000 80 1,080 Maturity Coupon Rate Par Value Cash Flow in 1-3 Cash Flow in 4 Assuming Annual compounding 4 years 6% 1,000 60 1,060 INVESTMENTS | BODIE, KANE, MARCUS 15-9
Price Using Spot Rates Bond A Spot Rate Cash Flow PV of Flow Period 1 .05 60 57.14 2 .0575 60 53.65 3 .063 60 49.95 4 .067 1,060 817.80 Total 978.54 INVESTMENTS | BODIE, KANE, MARCUS
Price Using Spot Rates Bond B Spot Rate Cash Flow PV of Flow Period 1 .05 80 76.19 2 .0575 80 71.54 3 .063 80 66.60 4 .067 1,080 833.23 Total 1,047.56 INVESTMENTS | BODIE, KANE, MARCUS
Solving For Yield to Maturity Bond A Bond Price YTM Bond B Price YTM 978.54 6.63% 1,047.56 6.61% https://dqydj.com/bond-yield-to-maturity- calculator/ INVESTMENTS | BODIE, KANE, MARCUS 15-12
Bond Pricing: Two Types of Yield Curves Pure Yield Curve Uses stripped or zero coupon Treasuries May differ significantly from the on-the-run yield curve On-the-Run Yield Curve Uses recently-issued coupon bonds selling at or near par The one typically published by the financial press INVESTMENTS | BODIE, KANE, MARCUS 15-13
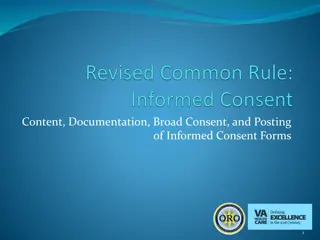
The Yield Curve and Future Interest Rates Yield Curve Under Certainty Suppose you want to invest for 2 years Buy and hold a 2-year zero or Rollover a series of 1-year bonds Equilibrium requires that both strategies provide the same return INVESTMENTS | BODIE, KANE, MARCUS 15-14
Figure 15.2 Two 2-Year Investment Programs INVESTMENTS | BODIE, KANE, MARCUS 15-15
The Yield Curve and Future Interest Rates Yield Curve Under Certainty Buy and hold vs. rollover: ( 1 y + ) ( )( ) 2 = + + 1 1 r r 2 1 2 1 2 ( )( ) + = + + 1 1 1 y r r 2 1 2 Next year s 1-year rate (r2) is just enough to make rolling over a series of 1-year bonds equal to investing in the 2-year bond: (1 + r2) = (1 + y2)2/(1 + r1) = (1.06)2/(1.05) = 1.0701 Thus, r2= 0.0701 = 7.01% INVESTMENTS | BODIE, KANE, MARCUS 15-16
The Yield Curve and Future Interest Rates Yield Curve Under Certainty Spot rate The rate that prevails today for a given maturity Short rate The rate for a given maturity (e.g. one year) at different points in time A spot rate is the geometric average of its component short rates INVESTMENTS | BODIE, KANE, MARCUS 15-17
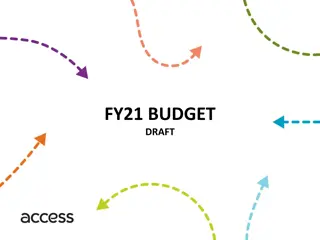
The Yield Curve and Future Interest Rates Short Rates and Yield Curve Slope When next year s short rate, r2, is greater than this year s short rate, r1, the yield curve slopes up May indicate rates are expected to rise When next year s short rate, r2, is less than this year s short rate, r1, the yield curve slopes down May indicate rates are expected to fall INVESTMENTS | BODIE, KANE, MARCUS 15-18
Figure 15.3 Short Rates versus Spot Rates INVESTMENTS | BODIE, KANE, MARCUS 15-19
The Yield Curve and Future Interest Rates Forward rates + y n 1 ( + ) y + = 1 ( ) n f n 1 n 1 ( 1) n fn= One-year forward rate for period n yn= Yield for a security with a maturity of n + = + + 1 n n 1 ( ) 1 ( ) 1 ( ) y y f 1 n n n INVESTMENTS | BODIE, KANE, MARCUS 15-20
Example 15.4 Forward Rates The forward interest rate is a forecast of a future short rate. Rate for 4-year maturity = 8%, rate for 3-year maturity = 7%. ( ) ( ) 07 . 1 1 3 + y 4 + 4 1 . 1 08 y + = = . 1 = 1 1106 4 f 4 3 3 4= 11 06 f . % INVESTMENTS | BODIE, KANE, MARCUS 15-21
Interest Rate Uncertainty and Forward Rates Suppose that today s rate is 5% and the expected short rate for the following year is E(r2) = 6%. The value of a 2-year zero is: 1000 $ = 898 $ 47 . ( . 1 )( . 1 ) 05 06 The value of a 1-year zero is: 1000 $ = 952 $ 38 . . 1 05 INVESTMENTS| BODIE, KANE, MARCUS 15-22
Interest Rate Uncertainty and Forward Rates The investor wants to invest for 1 year Buy the 1-year bond today and hold to maturity (will get 5% risk-free return) or Buy the 2-year bond today and plan to sell it at the end of the first year for $1000/1.06 =$943.40 943.40/898.47 1 = 0.05 = 5% What if next year s interest rate is more (or less) than 6%? The actual return using the 2-year bond is uncertain! INVESTMENTS| BODIE, KANE, MARCUS 15-23
Interest Rate Uncertainty and Forward Rates Investors require a risk premium to hold a longer-term bond This liquidity premium compensates short- term investors for the uncertainty about future prices INVESTMENTS| BODIE, KANE, MARCUS 15-24
Theories of Term Structure The Expectations Hypothesis Theory Observed long-term rate is a function of today s short-term rate and expected future short-term rates fn = E(rn)and liquidity premiums are zero INVESTMENTS| BODIE, KANE, MARCUS 15-25
Theories of Term Structure Liquidity Preference Theory Long-term bonds are more risky; therefore, fn generally exceeds E(rn) The excess of fn over E(rn)is the liquidity premium fn = E(rn) + liquidity premium The yield curve has an upward bias built into the long-term rates because of the liquidity premium INVESTMENTS| BODIE, KANE, MARCUS 15-26
Figure 15.4A-B Yield Curves INVESTMENTS| BODIE, KANE, MARCUS 15-27
Figure 15.4C-D Yield Curves INVESTMENTS| BODIE, KANE, MARCUS 15-28
Interpreting the Term Structure The yield curve reflects expectations of future interest rates The forecasts of future rates are clouded by other factors, such as liquidity premiums An upward sloping curve could indicate: Rates are expected to rise and/or Investors require large liquidity premiums to hold long term bonds INVESTMENTS| BODIE, KANE, MARCUS 15-29
Interpreting the Term Structure The yield curve is a good predictor of the business cycle Long term rates tend to rise in anticipation of economic expansion Inverted yield curve may indicate that interest rates are expected to fall and signal a recession INVESTMENTS| BODIE, KANE, MARCUS 15-30
Price Volatility of Long-Term Treasury Bonds INVESTMENTS| BODIE, KANE, MARCUS 15-31
Term Spread: Yields on 10-year vs. 90-day Treasury Securities INVESTMENTS| BODIE, KANE, MARCUS 15-32