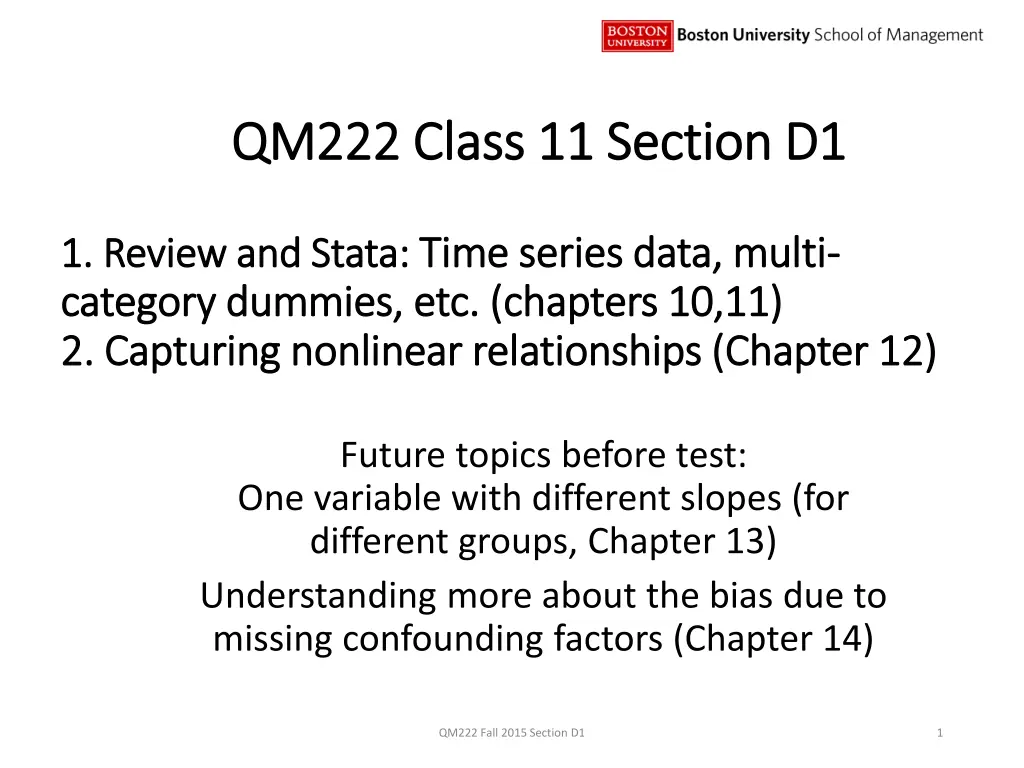
Explore capturing nonlinear relationships in time series data using Stata. Learn about creating time variables, including category dummies, and handling missing confounding factors. Dive into chapters 10, 11, and 12 to enhance your analysis techniques for future tests.
Please find below an Image/Link to download the presentation.
The content on the website is provided AS IS for your information and personal use only. It may not be sold, licensed, or shared on other websites without obtaining consent from the author. If you encounter any issues during the download, it is possible that the publisher has removed the file from their server.
You are allowed to download the files provided on this website for personal or commercial use, subject to the condition that they are used lawfully. All files are the property of their respective owners.
The content on the website is provided AS IS for your information and personal use only. It may not be sold, licensed, or shared on other websites without obtaining consent from the author.
E N D
Presentation Transcript
QM222 Class 11 Section D1 QM222 Class 11 Section D1 1. Review and Stata: 1. Review and Stata: Time category dummies, etc. (chapters 10,11) category dummies, etc. (chapters 10,11) 2. Capturing 2. Capturing nonlinear relationships (Chapter nonlinear relationships (Chapter 12) Time series series data, multi data, multi- - 12) Future topics before test: One variable with different slopes (for different groups, Chapter 13) Understanding more about the bias due to missing confounding factors (Chapter 14) QM222 Fall 2015 Section D1 1
Schedule Schedule Assignment 3 due today. Assignment 4: Due date moved to Friday 6pm. I very much hope to quickly look at your Assignment 3 to see if you are on the right track. QM222 Fall 2015 Section D1 2
Some of you are still unclear on wording Some of you are still unclear on wording An observation is what a row in your dataset represents. Your dependent variable is what is on the left hand side of the regression equation. Your explanatory (also called independent) variables are on the right hand side. If you can measure a possibly confounding variable, you want to include it among your explanatory variables. QM222 Fall 2015 Section D1 3
(review) In time (review) In time- -series data, you need to series data, you need to have a variable for time have a variable for time The variable for time has to increase by 1 each time period. If you have annual data, a variable Year does exactly this. If you have quarterly or monthly (or decade) data, you need to create a variable time. Sales = 1003 + 27 time The coefficient on time tells us that Sales increase by 27 each quarter. Quarterly data QM222 Fall 2015 Section D1 5
(review) Making a variable Time in Stata: (review) Making a variable Time in Stata: background background Note: in Stata, _n means the observation number In Stata, to refer to the previous value of a variable i.e. in the previous observation, just use the notation: varname[_n-1] The square brackets tells Stata the observation number you are referring to. QM222 Fall 2015 Section D1 6
Making a variable for Time in time Making a variable for Time in time- -series data in Stata (one observation per time data in Stata (one observation per time period) period) First make sure the data is in chronological order. For instance, if there is a variable date go: sort date Making a time variable (when the data is in chronological order) gen time=1 in 1 ( in # tell State to do this only for observation #) replace time= time[_n-1]+1 OR just: gen time= _n series QM222 Fall 2015 Section D1 7
Quarterly or monthly data Quarterly or monthly data With quarterly or monthly data, you should also include indicator variables for seasonality. For quarter data, make 3 indicator variables. The fourth is the reference (base) category. Example: Sales = 998 + 27 time - 4 Q1 + 10 Q2 + 12 Q3 Here, the coefficient on time tells us that Sales increase by 27 each quarter, holding season constant. Q4 is the reference category. Sales in Q2 on average are 10 more than Sales in Q4. Sales in Q1 on average are 4 less than Sales in Q4. QM222 Fall 2015 Section D1 8
(review) Running a Stata regression using a (review) Running a Stata regression using a categorical explanatory variables with many categorical explanatory variables with many categories categories You can make a single indicator variable in Stata easily, e.g. gen female = 0 replace female = 1 if gender==2 OR in a single line: gen female= gender==2 QM222 Fall 2015 Section D1 9
(review) Running a Stata regression using a (review) Running a Stata regression using a categorical explanatory variables with many categorical explanatory variables with many categories categories In Stata statistics, you don t need to make indicator variables separately for a variable with more than 2 categories. Assuming that you have a string (or numeric) categorical variable season that could take on the values Winter, Fall, Spring and Summer, type: regress sales price i.season This will run a multiple regression of sales on price and on 3 seasonal indicator variables. Stata chooses the reference category (it chooses the category it encounters first, although there is a way for you to set a different reference category if you want). Stata will name the indicator variables by the string or number of each value they take. QM222 Fall 2015 Section D1 10
Lets do this! Let s do this! Use hobbit data set(on our website, Other Materials, Data and other Materials) Make time variable. Make a weekend indicator variable. Regress Gross on time and weekend indicator. Interpret each coefficient. Regress Gross on time and day of week (Day) using i. Interpret each coefficient. QM222 Fall 2016 Section D1 11
Estimating nonlinear relationships Estimating nonlinear relationships Could the relationship be non-linear, and if so, how can we estimate this using linear regression? QM222 Fall 2015 Section D1 12
Non Non- -linear relationships between Y and X linear relationships between Y and X Sometimes, the relationship between the Y variable and the X variable is unlikely to be linear. This may lead you to measure a very low insignificant slope. e.g. If you ran a regression of this graph, its coefficient would be zero. QM222 Fall 2015 Section D1 13
Many of you believe that you might have Many of you believe that you might have nonlinear relationships nonlinear relationships e.g. Maybe job satisfaction goes up with age and then down again. e.g. You do not believe that an increase $1 in price will have the same effect going from $10 to $11 as going from $100 to $101. Note that this section is only applicable for numerical variables. You cannot do these nonlinear things with indicator variables. QM222 Fall 2015 Section D1 14
To solve the problem of Y possibly increasing To solve the problem of Y possibly increasing with X and then decreasing: with X and then decreasing: You simply add to the regression a new X variable that is a non-linear versions of old variable. My suggestion: estimate a quadratic by making a new variable X2 and run the regression with both the linear and non-linear (quadratic) term in the equation. If you don t know if a relationship is nonlinear, you can estimate the regression assuming it is nonlinear (e.g. quadratic) and then examine the results to see if this assumption is correct. 15 QM222 Fall 2015 Section D1
+ b1 1 X + b X + b2 2 X X2 2 Quadratic: Y = b Quadratic: Y = b0 0 + b 1400 600 1200 400 1000 200 800 0 600 -60 -40 -20 0 20 40 60 -200 400 -400 200 -600 0 -60 -40 -20 0 20 40 60 -200 -800 In high school you learned that quadratic equations look like this. So by adding a squared term, you can estimate these shapes. QM222 Fall 2015 Section D1 16
However, a regression with a quadratic can estimate However, a regression with a quadratic can estimate ANY part part of of these shapes these shapes ANY 1400 600 1200 400 1000 200 800 0 600 -60 -40 -20 0 20 40 60 -200 400 -400 200 -600 0 -60 -40 -20 0 20 40 60 -200 -800 So, using a quadratic does not mean that the curve need actually ever change from a positive to a negative slope or vice versa QM222 Fall 2015 Section D1 17
How do you know whether the relationship really How do you know whether the relationship really is is nonlinear nonlinear? ? Put in a nonlinear term (e.g. a squared term) and let the |t-stats| s in the equation tell you if it belongs in there. If the |t-stat|>2, you are more than 95% confident that the relationship is nonlinear. Even if |t-stat| < 2, it s a good idea to keep in the quadratic term as long as you are relatively confident it belongs in. I tend to leave it in if it has a | t-stat | >1, which means that I am at least 68% confident the relationship is nonlinear. Example: I know annual visitors to the park. I want to know if they are growing (or falling) at a constant rate over time, or not. First I make the variables: gen time= _n gen timesq = time^2 QM222 Fall 2015 Section D1 18
Here are regressions on time, then on time AND Here are regressions on time, then on time AND timesq Is the relationship nonlinear? Is the relationship nonlinear? Are visitors growing/shrinking, and at a constant rate? Are visitors growing/shrinking, and at a constant rate? timesq. . . regress annualvisitors time Source | SS df MS Number of obs = 23 -------------+------------------------------ F( 1, 21) = 1.74 Model | 1.1103e+11 1 1.1103e+11 Prob > F = 0.2010 Residual | 1.3382e+12 21 6.3722e+10 R-squared = 0.0766 -------------+------------------------------ Adj R-squared = 0.0326 Total | 1.4492e+12 22 6.5872e+10 Root MSE = 2.5e+05 ------------------------------------------------------------------------------ annualvisi~s | Coef. Std. Err. t P>|t| [95% Conf. Interval] -------------+---------------------------------------------------------------- time | -10474.59 7935.107 -1.32 0.201 -26976.55 6027.369 _cons | 1639786 108800.7 15.07 0.000 1413523 1866050 ------------------------------------------------------------------------------ . regress annualvisitors time timesq Source | SS df MS Number of obs = 23 -------------+------------------------------ F( 2, 20) = 35.96 Model | 1.1339e+12 2 5.6695e+11 Prob > F = 0.0000 Residual | 3.1528e+11 20 1.5764e+10 R-squared = 0.7824 -------------+------------------------------ Adj R-squared = 0.7607 Total | 1.4492e+12 22 6.5872e+10 Root MSE = 1.3e+05 ------------------------------------------------------------------------------ annualvisi~s | Coef. Std. Err. t P>|t| [95% Conf. Interval] -------------+---------------------------------------------------------------- time | 118497.8 16490.43 7.19 0.000 84099.37 152896.3 timesq | -5373.85 667.1316 -8.06 0.000 -6765.462 -3982.238 _cons | 1102401 85902.09 12.83 0.000 923212.7 1281590 ------------------------------------------------------------------------------ QM222 Fall 2015 Section D1 19
Sketching the Quadratic Sketching the Quadratic Visitors = 1102401 + 118498 time Visitors = 1102401 + 118498 time - - 5374 time2 2 5374 time The linear term in positive, so at a small X eg. X=0.1 the slope is positive. The squared is negative so the slope eventually becomes negatively sloped. So the general shape is as below. But which part of the curve is it? For those who don t think in derivatives, plug in high, medium and low values for X in the original equation. In this data, time goes from 1 to 23 so: At time=1, Visitors = 1102401 + 118498 (1) - 5374 (1) = 1,215,525 At time=10, Visitors = 1102401 + 118498 (10) - 5374 (102) =1,749,981 At time=23, Visitors = 1102401 + 118498 (23) - 5374 (232) =985,009 So over these 23 years, predicted visitors go up, then back down again. QM222 Fall 2015 Section D1 20
Sketching the Quadratic Sketching the Quadratic using calculus Visitors = 1102401 + 118498 time Visitors = 1102401 + 118498 time - - 5374 time using calculus 5374 time2 2 Calculus tells us the slope: dVisitors/dtime = 118498 2*5374 time The slope gets smaller as time increases. At the top of this cure, the slope is exactly zero. So solve 0 = 118498 2*5374 time time = 11.03 QM222 Fall 2015 Section D1 21
believe that a a 1% 1% increase increase in What about this issue: You What about this issue: You believe that have have the the same same % % effect on Y no matter what price you start at. effect on Y no matter what price you start at. [NOT ON TEST] [NOT ON TEST] e.g. You believe a 1 percent increase in price has a constant percentage effect on sales. Mathematical rule: If lnY = b0+ b1 lnX, b1 represents the % Y/ % X Or, the percentage change in Y when X changes by 1% (lnis natural log, the coefficient of e . Log means to the base 10. Either works.) So just make two new variables: lnY and lnX and run a regression: regress lnY lnX The coefficient will be: the percentage change in Y when X changes by 1% in X X will will QM222 Fall 2015 Section D1 22
A case when logs might be useful? A case when logs might be useful? If you have skewed data (like lifetime gross in movies), you could just regress ln(Lifetime gross) = b0 + b1ln(metascore) QM222 Fall 2015 Section D1 23
Back to the hobbit data set Back to the hobbit data set Make a variable for timesquared Run a regression of gross on time, timesquared, and the better of the other two (weekend indicator, or day of week indicator variables) Is the relationship between gross and time nonlinear? What does it look like? QM222 Fall 2015 Section D1 25
There are 3 ways you might deal with There are 3 ways you might deal with skewed data skewed data 1. Use logs for the skewed variable (if you believe the right relationship is with the percentage change). 2. If the skewed variable is the dependent variable, predict the median rather than the mean by going: qreg Yvariable Xvariable 3. You can topcode the variable (whether it is a dependent or explanatory variable) , for instance: replace LifetimeGross = 100000000 if LifetimeGross>100000000. QM222 Fall 2015 Section D1 27
More practice using Stata More practice using Stata What would you like me to demonstrate? Otherwise: Help each other. Where are you stuck? What don t you know how to do? What can you teach the others? QM222 Fall 2015 Section D1 28


 In time")
 Making a variable Time in Stata:")


 Running a Stata regression using a")
 Running a Stata regression using a")