Understanding Variance and Standard Deviation
Learn how to understand and calculate variance and standard deviation. Variance measures the spread of data by considering all values in a set, while standard deviation shows the amount of variation from the mean. Explore the formulas and step-by-step examples to grasp these statistical concepts effectively.

Download Presentation

Please find below an Image/Link to download the presentation.
The content on the website is provided AS IS for your information and personal use only. It may not be sold, licensed, or shared on other websites without obtaining consent from the author. If you encounter any issues during the download, it is possible that the publisher has removed the file from their server.
You are allowed to download the files provided on this website for personal or commercial use, subject to the condition that they are used lawfully. All files are the property of their respective owners.
The content on the website is provided AS IS for your information and personal use only. It may not be sold, licensed, or shared on other websites without obtaining consent from the author.
E N D
Presentation Transcript
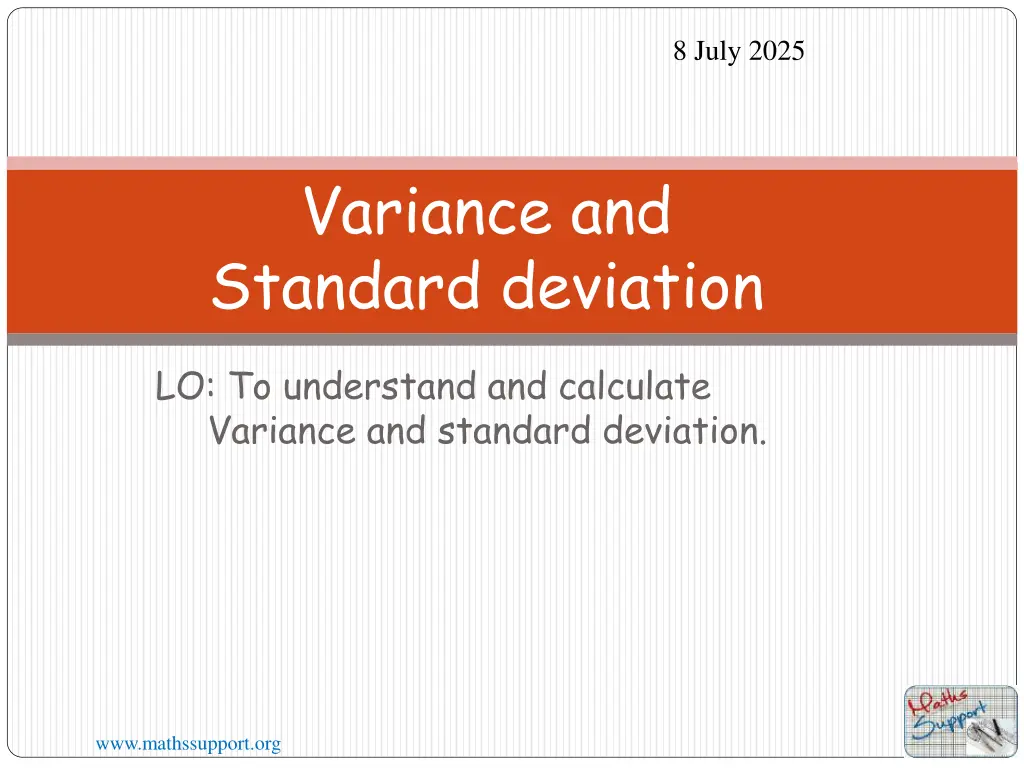
8 July 2025 Variance and Standard deviation LO: To understand and calculate Variance and standard deviation. www.mathssupport.org
Variance. The range and interquartile range are good measures of spread, but they are calculated from only two data values. The variance combines all the values in a data set to produce a measure of spread The variance is the arithmetic mean of the squared differences between each value and the mean value. ? ? ???? ?2 ?2= , where ?=1 ? = ?? ? ?=1 www.mathssupport.org
Variance. Squaring the difference between each value and the mean value has at least three advantages: squaring makes each term positive so that values above the mean do not cancel values below the mean squaring adds more weighting to the larger differences. The mathematics is relatively manageable when using this measure in subsequent statistical calculations. www.mathssupport.org
Variance. We can do some algebraic manipulation to deduce a simplified form of this formula ? ?? ?2 = ? ? 2 2??? + ?2 Expanding the square of the difference ?? ?2= ?=1 ?=1 ? ? ? ? 2 1 ?? ?? Using distributive properties. +?2 2? = ? ?=1 ?=1 ?=1 ? ? ? 2 ?? Using the definition of mean and simplifying the third sum +?2 ? = ? ?=1 2? ? ? ? ? 2 2 ?? ?? = ?2= 2?2 +?2 ?=1 ?2 ?=1 ? ? www.mathssupport.org
Standard Deviation. ? ? 2 ???? ???? ?2 ?2= ?2 = ?=1 ?=1 ? ? The Standard deviation ( ) is the square root of the variance ? ? 2 ???? ?2 ???? ?=1 ?=1 = ? = ?2 ? ? fi is every individual frequency xi is every individual datum is the mean. n is the quantity of numbers www.mathssupport.org
Standard Deviation. The Standard deviation of a distribution is a measure of spread affected by the size of each data value a commonly calculated and used statistic The Standard deviation shows how much variation there is from the mean. Although you will usually calculate the Standard deviation on the GDC we will see some examples to shows how to calculate the standard deviation step by step using the formula. www.mathssupport.org
All of the exam marks from a group of students: x 1 3 4 5 Calculate the variance and standard deviation Using this formula 8 9 ? ?? ?2 x - ? (x - ?)2 Score (x) 1 3 4 5 8 9 Step 4: add up this differences. ?=1 ? = 16 4 1 0 9 16 46 1 5 = 3 5 = 4 5 = 5 5 = 8 5 = 9 5 = -4 -2 -1 0 3 4 ? Calculate the mean Step 1: 1 + 3 + 4 + 5 + 8 + 9 6 30 6= ?= = 5 Step 2: Find the difference from the mean Step 3: Square this difference. Step 5: substitute into the formula for standard deviation. 46 = = = Standard deviation 7.67 . 2 77 6 www.mathssupport.org
All of the exam marks from a group of students: x 1 3 4 5 Calculate the variance and standard deviation Using this formula ? 8 9 x2 Score (x) 1 3 4 5 8 9 2 ?? ?=1 1 9 ? = ?2 ? Calculate the mean Step 1: 16 25 64 81 196 1 + 3 + 4 + 5 + 8 + 9 6 30 6= ?2 ?= = 5 Step 2: Find the square of x Step 4: Square the mean. Step 5: substitute into the formula for standard deviation. 25 = Step 3: add up this column. 196 6 = = 25 Standard deviation 7.67 . 2 77 ? = www.mathssupport.org
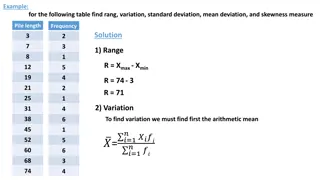
Example. Consider the following grouped frequency distribution f xi 400 1650 7200 7500 11 200 27 950 To calculate the mean we need fxi xi2 2500 22 500 90 000 250 000 640 000 f xi2 X f 8 11 24 15 14 72 MP (xi) 50 150 300 500 800 0 x < 100 100 x < 200 200 x < 400 400 x < 600 600 x < 1000 20 000 247 500 2 160 000 3 750 000 8 960 000 15 137 500 ?=27 950 72 ?= 388.2 ?2=150694.9 If we have a population summarised in a grouped frequency distribution, then work out the mid points. Using the formula for ? ? 2 ???? 2 ???? ?=1 ?2 ?=1 Variance = ?2= Standard deviation = ? = ?2 ? ? 15 137 500 72 ?2= Standard deviation = ? = 150 694.9 ?2 ?2=59 548.16 ? =244.02 www.mathssupport.org
Example. Consider the following grouped frequency distribution X f 8 11 24 15 14 72 Turn on the GDC 2 STAT MP (xi) 50 150 300 500 800 0 x < 100 100 x < 200 200 x < 400 400 x < 600 600 x < 1000 MENU If we are going to use the GDC, then we have to work out the mid points. www.mathssupport.org
Example. Consider the following grouped frequency distribution X f 8 11 24 15 14 72 Turn on the GDC 2 STAT MP (xi) 50 150 300 500 800 0 x < 100 100 x < 200 200 x < 400 400 x < 600 600 x < 1000 MENU Type in the values of MP in list 1 and the values of frequency in list 2 If we are going to use the GDC, then we have to work out the mid points. www.mathssupport.org
Example. Consider the following grouped frequency distribution X f 8 11 24 15 14 72 Turn on the GDC 2 STAT MP (xi) 50 150 300 500 800 0 x < 100 100 x < 200 200 x < 400 400 x < 600 600 x < 1000 MENU Type in the values of MP in list 1 and the values of frequency in list 2 If we are going to use the GDC, then we have to work out the mid points. F2 CALC www.mathssupport.org
Example. Consider the following grouped frequency distribution X f 8 11 24 15 14 72 Turn on the GDC 2 STAT MP (xi) 50 150 300 500 800 0 x < 100 100 x < 200 200 x < 400 400 x < 600 600 x < 1000 MENU Type in the values of MP in list 1 and the values of frequency in list 2 If we are going to use the GDC, then we have to work out the mid points. F2 F6 CALC SET www.mathssupport.org
Example. Consider the following grouped frequency distribution X f 8 11 24 15 14 72 Turn on the GDC 2 STAT MP (xi) 50 150 300 500 800 0 x < 100 100 x < 200 200 x < 400 400 x < 600 600 x < 1000 MENU Type in the values of MP in list 1 and the values of frequency in list 2 If we are going to use the GDC, then we have to work out the mid points. F2 F6 Scroll down to 1 Var Freq and press F2 2 EXE EXIT CALC SET www.mathssupport.org
Example. Consider the following grouped frequency distribution X f 8 11 24 15 14 72 Turn on the GDC 2 STAT MP (xi) 50 150 300 500 800 0 x < 100 100 x < 200 200 x < 400 400 x < 600 600 x < 1000 MENU Type in the values of MP in list 1 and the values of frequency in list 2 If we are going to use the GDC, then we have to work out the mid points. F2 F6 Scroll down to 1 Var Freq and press F2 2 EXE EXIT F1 1 VAR CALC SET www.mathssupport.org
Example. Consider the following grouped frequency distribution X f 8 11 24 15 14 72 Turn on the GDC 2 STAT MP (xi) 50 150 300 500 800 0 x < 100 100 x < 200 200 x < 400 400 x < 600 600 x < 1000 MENU Type in the values of MP in list 1 and the values of frequency in list 2 If we are going to use the GDC, then we have to work out the mid points. F2 F6 Scroll down to 1 Var Freq and press F2 2 EXE EXIT F1 1 VAR CALC SET ??? =244.02 www.mathssupport.org
Thank you for using resources from A close up of a cage Description automatically generated For more resources visit our website https://www.mathssupport.org If you have a special request, drop us an email info@mathssupport.org www.mathssupport.org