Understanding Wine Competition Ratings and Preferences
Explore the complexities of wine competition ratings, from the pitfalls of simple sums to the importance of considering both sum and dispersion. Discover how order/rank preference models can neutralize the need for such calculations, with real-world applications in various industries.

Download Presentation

Please find below an Image/Link to download the presentation.
The content on the website is provided AS IS for your information and personal use only. It may not be sold, licensed, or shared on other websites without obtaining consent from the author. If you encounter any issues during the download, it is possible that the publisher has removed the file from their server.
You are allowed to download the files provided on this website for personal or commercial use, subject to the condition that they are used lawfully. All files are the property of their respective owners.
The content on the website is provided AS IS for your information and personal use only. It may not be sold, licensed, or shared on other websites without obtaining consent from the author.
E N D
Presentation Transcript
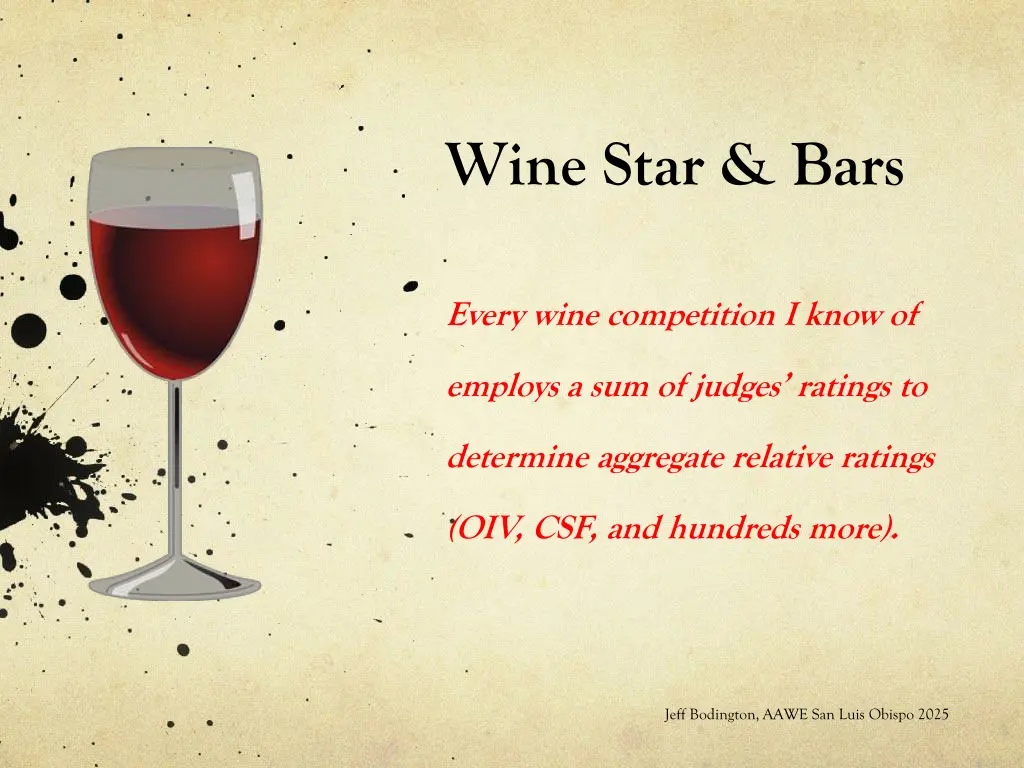
Wine Star & Bars Every wine competition I know of employs a sum of judges ratings to determine aggregate relative ratings (OIV, CSF, and hundreds more). Jeff Bodington, AAWE San Luis Obispo 2025
Simple sums of ratings are perilous What is wrong with a simple sum of ratings? Seven things. Ratings are stochastic (so are sums) Sample sizes are small (LLN, Cochrane 1937) The score range effect biases influence Ranks ignore differential intensity Some judges are more consistent than others (> 30 sources) Definition of and adherence to rating standards is opaque A sum is not an aggregate utility Billions of compositions can have the same sum (Stars & Bars) If you must take a sum, consider dispersion too. Jeff Bodington, AAWE San Luis Obispo 2025
How many compositions of ratings have the same sum? Stars & Bars: The composition ***|*****|** has ten *. How many have ten *? 18 Ch Montelena Meursault Charmes Chalone Vineyards Spring Mountain Freemark Abbey Batard-Montrachet Puligny-Montrachet Beaune, Clos des Mouches Veedercrest 16 14 12 Frequency of Sum, billions David Bruce 10 8 6 4 2 0 0 20 40 60 80 100 120 140 160 180 Sum of Ratings by Nine Judges on a Wine Jeff Bodington, AAWE San Luis Obispo 2025
Consider both sum and dispersion Should Chateau Montelena have been declared the winner in Paris over Meursault Charmes? 1 0.95 0.9 Meursault Charmes Tastle & Wierman Consensus Chalone Vineyards Spring Mountain Batard-Montrachet 0.85 Freemark Abbey Puligny-Montrachet Veedercrest 0.8 David Bruce 0.75 Ch Montelena 0.7 Beaune, Clos des Mouches 0.65 0.6 40 60 80 100 120 140 160 Sums of Ratings Jeff Bodington, AAWE San Luis Obispo 2025
Order/Rank Preference Models neuter the need to consider sums and dispersions Applications to taste tests are common: pudding (Davidson, 1970) snap beans (Plackett, 1975) crackers (Critchlow, 1980) salad (Critchlow & Fligner, 1991) soft drinks (Bockenholt, 1992) animal feed (Marden, 1995) cheese snacks (Vigneau, 1999) salad dressings (Theusen, 2007) sushi (Chen, 2014) sweet potato (Moyo, 2021) wine (Bodington, 2015, 2025). Application of Plackett-Luce to the Paris 1976 white wines shows: Plackett-Luce often used in AI/ML applications, yields top-choice probabilities. p(Meursault Charmes top choice) > p(Chateau Montelena top choice). p(California, 4 out of top 5) > p(France, 1 out of top 5). Jeff Bodington, AAWE San Luis Obispo 2025