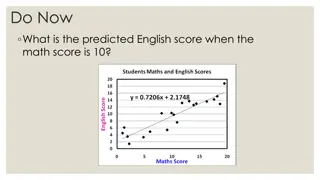
Explore the concept of Z-scores and relative frequency histograms with examples and visuals. Learn how to interpret data points in relation to the mean using standard deviations. Gain insights into normal distribution and its applications in real-world scenarios.
Please find below an Image/Link to download the presentation.
The content on the website is provided AS IS for your information and personal use only. It may not be sold, licensed, or shared on other websites without obtaining consent from the author. If you encounter any issues during the download, it is possible that the publisher has removed the file from their server.
You are allowed to download the files provided on this website for personal or commercial use, subject to the condition that they are used lawfully. All files are the property of their respective owners.
The content on the website is provided AS IS for your information and personal use only. It may not be sold, licensed, or shared on other websites without obtaining consent from the author.
62 72 64 62 63 66 71 73 68 73 66 62 64 63 60 76 Frequency vs. Relative frequency (Histograms) Frequency Quantity (#) of data in a class Relative frequency % of data that falls in a class Written in decimal form Always adds up to 1 (or 100%) Example. Heights in inches (Spring 2014 classes) 54 68 59 60 62 64 20 66 71 66 62 67 72 70 64 68 68 73 63 57 56 65 68.5 68 63 62 69 73 71 62 68
4 of 16 Density curve A relative-frequency histogram with a curve going through the (invisible) midpoint of each (invisible) bar Area = 1 (or 100%) Useful for describing position of individuals within a distribution
5 of 16 EXAMPLE. Relative frequency histogram. 0.5 .46 0.4 0.3 0.2 .19 .19 0.1 .08 .08 0.0
7 of 16 EXAMPLE. Density curve, correct (but sharp). 0.5 0.4 0.3 0.2 .19 .19 0.1 .08 .08 0.0
8 of 16 EXAMPLE. Density curve, correct. 0.5 0.4 0.3 0.2 .19 .19 0.1 .08 .08 0.0
9 of 16 Z-scores (super-important) The z-score of an individual is the number of standard deviations away from the mean. The average American male weighs 170 pounds, with a standard deviation of 30 pounds. If I weigh 155 pounds, what is my z-score? ( ) x x ( ) observatio n mean = = z z . . s d Only with symmetric distributions.
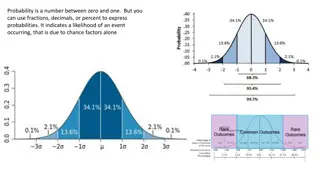
10 of 16 Normal Distribution (use with z) Symmetric, single-peaked, bell-shaped Also called bell curve Important because it describes lots of real-world situations BUT ..non-Normal data are common. Don t assume Normality. Your guesses of my weight Your guesses of my age Your GPA s z-scores real -2 -2 -1 0 1 2 3 -3 -3 +1 +2 +3 -1
41 76 -10 -61 -13 22 -16 -17 8 -50 33 -125 93 -84 -10 120 55 7 20 95 -44 1 -37 -27 -94 -57 8 45 -31 69 Is it Normal? Option 1 It says so in the problem. Done. Option 2 Construct a normal quantile/prob. plot (graph type #6) x axis x Linear = Normal Option 3 Compare to Empirical rule y axis z
12 of 16 Empirical Rule (68 In a Normal distribution with mean and standard deviation . A lot of data (68%) fall within one of Most data (95%) fall within two of Almost all data (99%) fall within three of 68-95 95-99 99)
13 of 16 z-scores proportions Z-chart will tell you the area below any z-score in a Normal distribution. Area = proportion = probability = percentile
15 of 16 Using z-scores (example) Each SAT test is curved so the mean 500 with =100. Let s say Chase scores 540 on the SAT Math. 540 500 1. What is his z-score? = 4 . 0 100 2. What percentage of people scored worse than Chase? 3. What is the probability of doing better than 540?
16 of 16 Example of test problem The heights of American men are approximately normally distributed, with a mean of =70 inches and a standard deviation of =3 inches. What percentage of American men are at least as tall as Mr. Colligan, who is 75 inches tall? z = 75-70 = 1.67 3 Area under 1.67 .9525 Area above 1.67 1 - .9525 = .0475 About 4.75% of American men are at least as tall as Mr. Colligan.
FRQ #9: Answers 9. Human pregnancies are Normal with mean 266 days and standard deviation 16 days. a. What percent of pregnancies last less than 240 days? = z z-score =x 0516 . 0 z Chart 240 266 = . 1 63 16 b. What percent of pregnancies last between 240 and 270 days? Real world % (check for 1-) 0516 . 0 270 266 240 266 = . 0 25 = . 1 63 5987 . 0 16 16 c. How long do the longest 20% of pregnancies last? 0516 . 0 266 =x = 5987 . 0 5471 . 0 = x 279 44 . . 0 84 16
FRQ #10 10. One of the most popular IQ tests is called the Stanford- Binet Intelligence Scale . Scores on this test are generally Normally distributed with a mean of 95 and =15. a. If someone scores at the 16th percentile, about what score did that individual have? b. Suppose that among 1000 individuals, a person named Einstein scores 130. How many of those 1000 individuals scored higher than Einstein?
FRQ #10: ANSWERS 10. One of the most popular IQ tests is called the Stanford-Binet Intelligence Scale . Scores on this test are generally Normally distributed with a mean of 95 and =15. a. If someone scores at the 16th percentile, about what score did that individual have? b. Suppose that among 1000 individuals, a person named Einstein scores 130. How many of those 1000 individuals scored higher than Einstein? 16th percentile in chart 95 x = . 0 99 15 = x 80 15 . 130 95 = = . 2 33 z 15 0099 . 0 9 . 9 1000 9901 . 0 0099 . 0 = 1 = Looked up z=2.33 in chart
Station E: Using the z-score formula Assume Normality for the following questions. 1. I score 93% on a test. The average was 85%, with a standard deviation of 6.5%. What is my z-score? 2. An In-n-Out hamburger weighs an average of 0.7 pounds, with =0.025. If my burger has a z-score of -3.6, how much does my hamburger weigh? 3. An average American adult male weighs 170 pounds. If my weight of 147 gives me a z-score of -1.4375, what is the standard deviation of the weights of adult American males?
Station E: ANSWERS Using the z-score formula 93 85 1. I score 93% on a test. The average was 85%, with a standard deviation of 6.5%. What is my z-score? = . 1 = 23 z 5 . 6 2. An In-n-Out hamburger weighs an average of 0.7 pounds, with =0.025. If my burger has a z-score of -3.6, how much does my hamburger weigh? 7 . 0 x 6 . 3 = 025 61 . 0 . 0 = x 3. An average American adult male weighs 170 pounds. If my weight of 147 gives me a z-score of -1.4375, what is the standard deviation of the weights of adult American males? 147 170 4375 . 1 = = 16


")