Understanding Z-scores in Statistics: Examples and Practice Questions
Dive into the world of Z-scores with examples and practice questions. Learn how to calculate z-scores, interpret them, and apply them to real-life scenarios. Explore skewed curves, percentiles, mean, standard deviation, and more.

Download Presentation

Please find below an Image/Link to download the presentation.
The content on the website is provided AS IS for your information and personal use only. It may not be sold, licensed, or shared on other websites without obtaining consent from the author. If you encounter any issues during the download, it is possible that the publisher has removed the file from their server.
You are allowed to download the files provided on this website for personal or commercial use, subject to the condition that they are used lawfully. All files are the property of their respective owners.
The content on the website is provided AS IS for your information and personal use only. It may not be sold, licensed, or shared on other websites without obtaining consent from the author.
E N D
Presentation Transcript
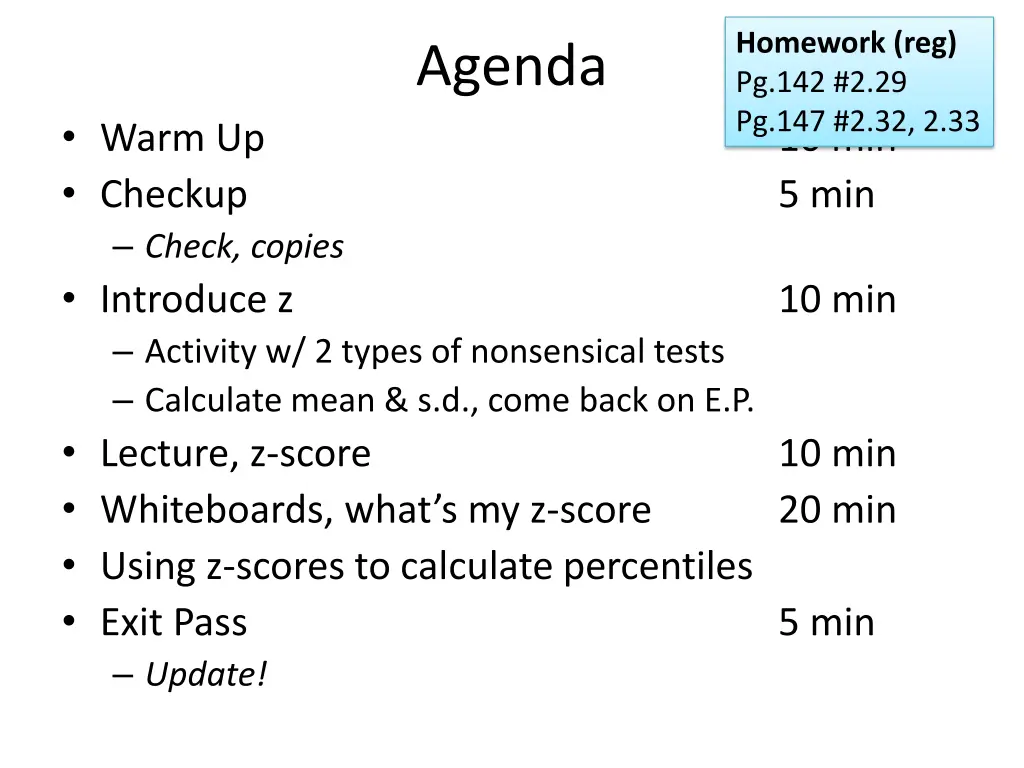
Homework (reg) Pg.142 #2.29 Pg.147 #2.32, 2.33 Agenda Warm Up Checkup Check, copies Introduce z Activity w/ 2 types of nonsensical tests Calculate mean & s.d., come back on E.P. Lecture, z-score Whiteboards, what s my z-score Using z-scores to calculate percentiles Exit Pass Update! 10 min 5 min 10 min 10 min 20 min 5 min
Warm Up Sketch a density curve that is: 1. Skewed left 2. Skewed right 3. Bimodal 4. Uniform 5. Symmetric but not uniform 6. Skewed right with an extreme outlier 7. Johnny scores in the 65th percentile on the Unit 1 quiz. What does that mean?
Notes Z-scores (super-important) 1 of 5 The z-score of an individual is the number of standard deviations away from the mean. The average American male weighs 170 pounds, with a standard deviation of 30 pounds. If I weigh 155 pounds, what is my z-score? ( d s ( ) x x ) observatio n mean = = z z . . Only with symmetric distributions. Why?
Example with quiz scores (P.2) Awesomeness Josh Taylor Hayley Syed Shayanne Aleftina Ari Allyson Melissa Karina Anthony Kayla IQ 8 6 5 5 4 3 2 2 2 2 0 0 Joey Lisette Darya Gurpreet Jamie Spencer Beloved Claudia Riya Camille Daniel 6 5 5 5 4 4 4 3 3 2 1 Mean St.dev 3.25 2.31 Mean St.dev 3.82 1.41
Door/Window.Whats my z-score? Tell partner: The distribution has mean ___ and standard deviation ___. I m ____. What is my z-score? Each person practice five times. Example.
Do both. Mr. Colligan weighed 13.9 lbs at 3 months. The national average for the weight of a 3-month baby is 12.5 lbs, with standard deviation 1.5 lbs. 1. Determine the z-score of Mr. Colligan s weight. For a 6-month-old, the national average weight is 17.25 lbs, with a standard deviation of 2.0 lbs. 2. Determine what Mr. Colligan s weight would have been at age 6 months for him to have the same z-score that he did at 3 months.
Door/Window Suppose that your score on an exam has a positive z-score compared to your classmates. Explain your answers to the following: 1. Is it possible that your score is below the mean score? 2. Is it possible that your score is below the median score? 3. Does this imply that your score is more than one standard deviation above the mean? 4. Is it possible that your score is the largest in the class? Window Door Window Door
Notes Normal Distribution (use with z) Symmetric, single-peaked, bell-shaped Sometimes called bell curve Important because it describes lots of real-world situations BUT ..non-Normal data are common. Don t assume Normality. Label with z-scores and real values 2 of 5 Your guesses of my weight Your guesses of my age Your estimates of 1 minute z-scores real -2 ? -1 ? 0 1 ? 2 ? 3 ? -3 ? Mean
Notes 41 76 -10 -61 -13 22 -16 -17 8 -50 33 -125 93 -84 -10 120 55 7 20 95 -44 1 -37 -27 -94 -57 8 45 -31 69 Is it Normal? 3 of 5 Option 1 It says so in the problem. Done. Option 2 Construct a normal quantile/prob. plot (graph type #6) x axis x Linear = Normal Option 3 Compare to Empirical rule y axis z
n=17 Try it! Construct a normal quantile plot for the heights of my students. 56 58 61 61 62 62 63 63.5 65 66 67 67 67 67 70 72 75
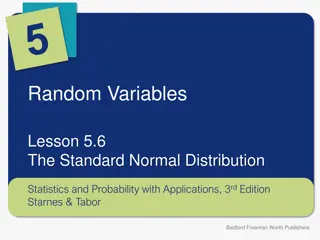
Empirical Rule (68-95-99) In a Normal distribution with mean and standard deviation . A fair amount of data (68%) fall within one of Lots of data (95%) fall within two of Most data (99%) fall within three of Notes 4 of 5
Using z-scores to get proportions Each SAT section is curved so =500 and =100 (which is awesome for AP Statistics teachers) I earn 600 on the Math portion. What is the z-score? What is the probability of earning at least 600 on the Math section of the SAT? What is the probability of earning at least 625?
Using z-scores to get proportions A chart of standard Normal probabilities will tell you the area below any z-score Area = proportion = probability = percentile
Notes Using z-scores (example) 5 of 5 Each SAT test is curved so the mean 500 with =100. Let s say you score 625 on the SAT Math. 625 500 . 1 = 25 1. What is my z-score? 100 2. What percentage of people scored worse than you? 3. What is the probability of doing better than 625?
Notes? More examples 1. z 1.5 2. z 1.5 3. -1.5 z 1.5 4. -0.7 z 1.5
Door/Window Door: Say any two z-scores between -3 and 3 Door/Window: Find the probability of falling within those two z-scores. Door/Window: Compare answers. Window: Say two new z-scores between -3 and 3. Four times total.
Example of test problem The heights of American men are approximately normally distributed, with a mean of =70 inches and a standard deviation of =3 inches. What percentage of American men are at least as tall as Mr. Colligan, who is 75 inches tall? Notes? z = 75-70 = 1.67 3 Area under 1.67 .9525 Area above 1.67 1 - .9525 = .0475 About 4.75% of American men are at least as tall as Mr. Colligan.
You try The level of cholesterol in the blood is important because high cholesterol levels may increase the risk of heart disease. The distribution of blood cholesterol levels in a large population of people of the same age and sex is roughly Normal. For 14-year-old boys, the mean is =170 milligrams of cholesterol per deciliter of blood (mg/dl) and the standard deviation is =30 mg/dl. Levels above 240 mg/dl may require medical attention. What percent of 14-year-old boys have more than 240 mg/dl of cholesterol? 1. Draw and label a Normal curve. 2. Use the table to calculate the z-score and associated percentile. 3. State your conclusion in context.
Door/Window Competition Each of you writes a z-score on your whiteboard Show each other Calculate the area between those z-scores. Winner First with the correct answer written on their whiteboard. 3 rounds
Homework (reg) Pg.142 #2.29 Pg.147 #2.32, 2.33 Exit Pass (P.2) 1. What is the standardized (z) score you earned on your quiz from the beginning of class? Also state which quiz you took, IQ or Awesome . 2. What would you have to score to earn a z-score of 0 on your quiz? 3. What would you have to score to earn a z-score of 2 on your quiz? Awesomeness Mean St.dev IQ 3.25 2.31 Mean St.dev 3.82 1.41
Example with quiz scores (P.2) Awesomeness Josh Taylor Hayley Syed Shayanne Aleftina Ari Allyson Melissa Karina Anthony Kayla IQ 8 6 5 5 4 3 2 2 2 2 0 0 Joey Lisette Darya Gurpreet Jamie Spencer Beloved Claudia Riya Camille Daniel 6 5 5 5 4 4 4 3 3 2 1 Mean St.dev 3.25 2.31 Mean St.dev 3.82 1.41
")


")


")


")