Explore the rankings of US states by unemployment rate and annual nonagricultural employment change in May 2020. Discover which states had the highest and lowest unemployment rates and employment changes, providing valuable insights into the economic landscape during that period.
Please find below an Image/Link to download the presentation.
The content on the website is provided AS IS for your information and personal use only. It may not be sold, licensed, or shared on other websites without obtaining consent from the author. If you encounter any issues during the download, it is possible that the publisher has removed the file from their server.
You are allowed to download the files provided on this website for personal or commercial use, subject to the condition that they are used lawfully. All files are the property of their respective owners.
The content on the website is provided AS IS for your information and personal use only. It may not be sold, licensed, or shared on other websites without obtaining consent from the author.
E N D
Presentation Transcript
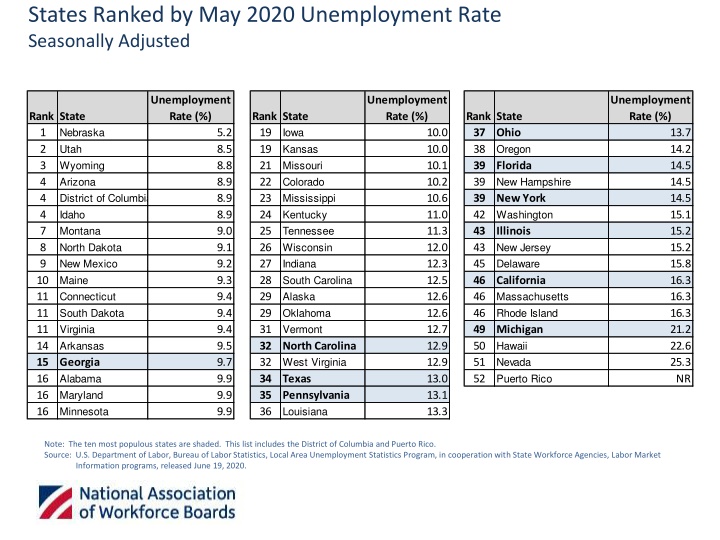
States Ranked by May 2020 Unemployment Rate Seasonally Adjusted Unemployment Rate (%) Unemployment Rate (%) Unemployment Rate (%) Rank State 1 2 3 4 4 4 7 8 9 10 11 11 11 14 15 Georgia 16 Alabama 16 Maryland 16 Minnesota Rank State 19 19 21 22 23 24 25 26 27 28 29 29 31 32 North Carolina 32 West Virginia 34 Texas 35 Pennsylvania 36 Louisiana Rank State 37 Ohio 38 39 Florida 39 New Hampshire 39 New York 42 Washington 43 Illinois 43 New Jersey 45 Delaware 46 California 46 Massachusetts 46 Rhode Island 49 Michigan 50 Hawaii 51 Nevada 52 Puerto Rico Nebraska Utah Wyoming Arizona District of Columbia Idaho Montana North Dakota New Mexico Maine Connecticut South Dakota Virginia Arkansas Iowa Kansas Missouri Colorado Mississippi Kentucky Tennessee Wisconsin Indiana South Carolina Alaska Oklahoma Vermont 5.2 8.5 8.8 8.9 8.9 8.9 9.0 9.1 9.2 9.3 9.4 9.4 9.4 9.5 9.7 9.9 9.9 9.9 10.0 10.0 10.1 10.2 10.6 11.0 11.3 12.0 12.3 12.5 12.6 12.6 12.7 12.9 12.9 13.0 13.1 13.3 13.7 14.2 14.5 14.5 14.5 15.1 15.2 15.2 15.8 16.3 16.3 16.3 21.2 22.6 25.3 NR Oregon Note: The ten most populous states are shaded. This list includes the District of Columbia and Puerto Rico. Source: U.S. Department of Labor, Bureau of Labor Statistics, Local Area Unemployment Statistics Program, in cooperation with State Workforce Agencies, Labor Market Information programs, released June 19, 2020.
States Ranked by Annual Nonagricultural Employment Change May 2020, Seasonally Adjusted Over-the-Year Change (Jobs) Over-the-Year Change (Jobs) Over-the-Year Change (Jobs) -340,900 -368,100 -381,600 -387,700 -403,100 -408,500 -504,800 -605,000 -689,500 -737,900 -757,600 -850,000 -850,400 -863,800 -917,800 -1,794,000 -2,267,100 Rank State 1 2 3 4 5 5 7 8 9 10 11 12 13 14 15 16 17 18 Rank State 19 20 21 22 23 24 25 26 27 28 29 30 31 32 33 34 35 36 Rank State 37 38 39 40 41 42 43 44 45 46 47 48 49 50 51 52 53 Virgin islands Wyoming South Dakota Alaska Montana North Dakota Idaho Vermont District of Columbia Delaware Nebraska Utah Rhode Island New Mexico Mississippi Maine Arkansas West Virginia Puerto Rico New Hampshire Kansas Oklahoma Hawaii Alabama Arizona Iowa South Carolina Oregon Louisiana Colorado Nevada Connecticut Tennessee Missouri Kentucky Maryland Indiana Virginia Minnesota Wisconsin Georgia Washington North Carolina Massachusetts New Jersey Illinois Ohio Michigan Florida Pennsylvania Texas New York California -400 -95,400 -99,900 -110,100 -123,900 -131,600 -160,800 -167,000 -174,600 -193,000 -225,900 -236,000 -236,200 -245,300 -251,400 -265,800 -283,600 -286,900 -329,700 -26,900 -33,100 -40,700 -41,600 -41,600 -44,900 -54,100 -67,000 -72,700 -72,800 -75,000 -79,900 -84,300 -87,100 -87,300 -91,000 -91,400 Note: The ten most populous states are shaded. This list includes the District of Columbia, Puerto Rico, and the Virgin Islands. Source: U.S. Department of Labor, Bureau of Labor Statistics, Current Employment Statistics Program, in cooperation with State Workforce Agencies, Labor Market Information programs, released June 19, 2020.
States Ranked by Annual Nonagricultural Employment Percentage Change May 2020, Seasonally Adjusted Over-the-Year Change (%) Over-the-Year Change (%) Over-the-Year Change (%) Rank State 1 2 3 4 5 5 7 8 9 9 11 12 13 14 14 16 17 17 Rank State 19 20 21 21 23 24 25 26 27 28 29 30 31 31 33 34 35 36 Rank State 37 37 39 40 41 42 43 44 45 46 47 48 49 50 51 52 53 Virgin islands Utah Arizona Idaho Arkansas Nebraska Texas Oklahoma Mississippi South Dakota Kansas Alabama District of Columbia Colorado Tennessee Montana Georgia South Carolina Virginia Wyoming Florida North Dakota Missouri New Mexico Indiana Puerto Rico Iowa North Carolina Oregon Washington Louisiana Maryland Illinois Alaska West Virginia Minnesota California Wisconsin Ohio Maine Pennsylvania New Hampshire Kentucky Connecticut Delaware Rhode Island Massachusetts New Jersey Vermont Nevada New York Michigan Hawaii -1.1% -4.8% -5.7% -5.9% -7.1% -7.1% -7.2% -7.3% -7.5% -7.5% -7.7% -7.8% -8.4% -8.5% -8.5% -8.6% -8.8% -8.8% -9.1% -9.3% -9.5% -9.5% -9.8% -9.9% -10.7% -10.9% -11.0% -11.1% -11.7% -11.8% -11.9% -11.9% -12.1% -12.4% -12.7% -12.8% -13.0% -13.0% -13.6% -13.8% -14.3% -14.6% -14.8% -14.9% -15.6% -15.9% -16.4% -16.5% -17.1% -17.3% -18.3% -19.2% -20.1% Note: The ten most populous states are shaded. This list includes the District of Columbia, Puerto Rico, and the Virgin Islands. Source: U.S. Department of Labor, Bureau of Labor Statistics, Current Employment Statistics Program, in cooperation with State Workforce Agencies, Labor Market Information programs, released June 19, 2020.
States Ranked by Labor Force Participation Rate May 2020, Seasonally Adjusted The labor force participation rate represents the proportion of the civilian noninstitutional population that is in the labor force. Labor Force Participation Rate (%) Labor Force Participation Rate (%) Labor Force Participation Rate (%) Rank State 1 2 3 4 5 6 7 8 9 10 11 12 12 14 15 15 17 Note: The ten most populous states are shaded. This list includes the District of Columbia. Source: U.S. Department of Labor, Bureau of Labor Statistics, Local Area Unemployment Statistics Program, in cooperation with State Workforce Agencies, Labor Market Information programs, released June 19, 2020. Rank State 18 18 20 21 22 22 24 25 26 27 28 29 30 31 32 33 34 Rank State 35 36 36 38 39 40 40 42 42 44 45 46 47 48 49 50 51 Nebraska Minnesota North Dakota South Dakota Iowa Kansas Utah District of Columbia Wisconsin Colorado Vermont Wyoming Maryland Washington Virginia New Hampshire New Jersey Idaho Indiana Illinois Pennsylvania Missouri Massachusetts Ohio Oregon Connecticut Alaska Arizona Montana Tennessee Texas Rhode Island Delaware Oklahoma Maine California Michigan Georgia South Carolina New York Hawaii Alabama Kentucky North Carolina Louisiana Arkansas Nevada Florida New Mexico West Virginia Mississippi 70.7 68.9 68.7 68.6 68.2 67.4 67.2 66.8 66.6 66.5 66.1 65.2 65.2 64.7 64.4 64.4 63.9 63.2 63.2 63.0 62.9 62.4 62.4 62.1 61.6 61.4 61.3 61.0 60.9 60.8 60.7 60.3 60.1 59.8 59.6 59.3 59.3 59.1 58.8 58.2 58.2 58.0 58.0 57.9 57.3 57.1 56.1 55.1 54.9 54.1 52.8
States Ranked by Employment to Population Ratio May 2020, Seasonally Adjusted The employment to population ratio represents the proportion of the civilian noninstitutional population that is employed. Employment to Population Ratio (%) Employment to Population Ratio (%) Employment to Population Ratio (%) Rank State 1 2 3 3 5 6 7 8 9 10 11 12 13 14 15 16 17 Rank State 18 18 20 21 21 23 24 25 26 27 27 29 29 31 32 33 34 Rank State 34 36 37 38 39 40 41 42 43 44 44 46 46 48 49 50 51 Nebraska North Dakota Minnesota South Dakota Utah Iowa District of Columbia Kansas Colorado Wyoming Maryland Wisconsin Virginia Vermont Idaho Missouri Connecticut Indiana Arizona Montana Washington New Hampshire Pennsylvania New Jersey Maine Tennessee Ohio Alaska Illinois Georgia Oregon Texas Oklahoma Massachusetts Alabama Arkansas Kentucky South Carolina Delaware Rhode Island North Carolina New Mexico New York California Louisiana West Virginia Mississippi Florida Michigan Hawaii Nevada 67.1 62.5 62.1 62.1 61.5 61.4 60.9 60.6 59.7 59.5 58.8 58.6 58.4 57.7 57.6 56.1 55.6 55.5 55.5 55.4 55.0 55.0 54.6 54.2 54.1 53.9 53.5 53.5 53.4 53.4 52.9 52.8 52.3 52.2 52.2 51.7 51.6 51.5 50.6 50.5 50.4 49.9 49.8 49.6 49.6 47.2 47.2 47.1 46.8 45.0 41.9 Note: The ten most populous states are shaded. This list includes the District of Columbia. Source: U.S. Department of Labor, Bureau of Labor Statistics, Local Area Unemployment Statistics Program, in cooperation with State Workforce Agencies, Labor Market Information programs, released June 19, 2020.
Florida Department of Economic Opportunity, Bureau of Workforce Statistics and Economic Research Products and Services that Support Economic Development Labor supply studies for business recruitment Labor cost analysis for business site selection Skills-matching analysis for reemployment Economic impact analysis for job creation / return on investment GIS maps for business recruitment / economic development Vacancy / hiring needs surveys for reemployment Targeted occupations for reemployment Targeted industry profiles for job creation Employer listings for business recruitment Competitive analysis for prison industry staffing Competitive analysis for federal rural business loans Targeted Employment Areas (TEAs) for foreign investor program Labor shed and Census commuting patterns for job creation Area job market profiles