University Education Budget Proposal for Fiscal Year 2018-19
"Explore the detailed budget proposal for education and general fund for the fiscal year 2018-19 presented at the Council of Trustees meeting. The proposal includes major assumptions, enrollment and revenue projections, expenditure breakdown, and total university budget overview."
Download Presentation

Please find below an Image/Link to download the presentation.
The content on the website is provided AS IS for your information and personal use only. It may not be sold, licensed, or shared on other websites without obtaining consent from the author. If you encounter any issues during the download, it is possible that the publisher has removed the file from their server.
You are allowed to download the files provided on this website for personal or commercial use, subject to the condition that they are used lawfully. All files are the property of their respective owners.
The content on the website is provided AS IS for your information and personal use only. It may not be sold, licensed, or shared on other websites without obtaining consent from the author.
E N D
Presentation Transcript
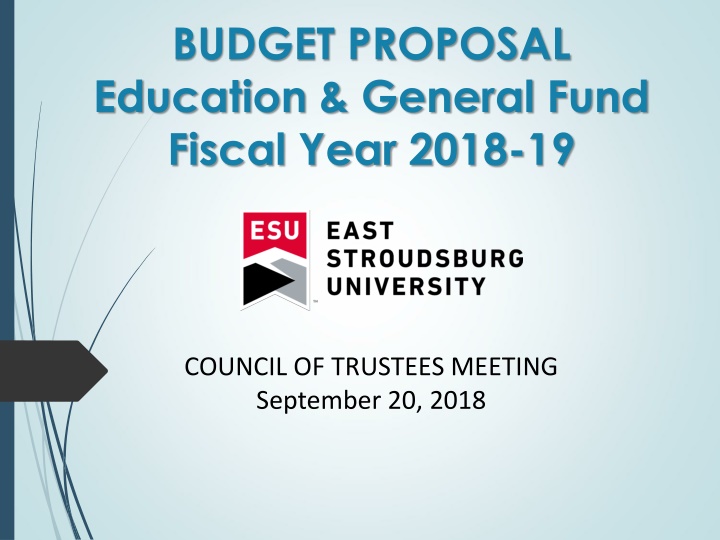
BUDGET PROPOSAL Education & General Fund Fiscal Year 2018-19 COUNCIL OF TRUSTEES MEETING September 20, 2018
Contents A. Major Budget Assumptions B. Enrollment & Revenue Projections C. Expenditure Projections D. Educational & General Budget E. Total University Budget
Assumptions 2018-19 Proposed Budget 2.99% 2017-18 Budget 3.5% 2017-18 Actual 3.5% Tuition Rate Enrollment State Appropriation Salaries Benefits Utilities (.4)% (3.7)% (4.7)% 2.0% 3.6% 6.0% 2.1% 10.0% 4.5% 1.0% 1.1% 5.6% 3.6% .2% (2.2)%
2018-19 Enrollment & Revenue Projections
Fall Headcount 2018-19 Proposed Budget 2017-18 Actual Change In-State Undergrad 4,799 4,485 (314) Out-of-State Undergrad 1,252 1,234 (18) In-State Graduate 563 579 16 Out-of-State Graduate 128 130 2 Total Headcount 6,742 6,428 (314)
Annualized FTE Enrollment 2018-19 Proposed Budget 2017-18 Actual Change In-State Undergrad 4,482 4,291 (191) Out-of-State Undergrad 1,216 1,124 (92) In-State Graduate 399 423 24 Out-of-State Graduate 126 142 16 Total FTE Enrollment 6,223 5,980 (243)
E&G Revenue (in millions) 2018-19 Proposed Budget 2017-18 Actual Change Tuition & Fees $70.73 $72.07 $1.34 State Appropriation 27.03 28.66 1.63 Other Income Planned Use of Carryforward 5.78 4.83 (.95) .00 (.76) (.76) Total Revenue $103.54 $104.80 $1.26 Note: Totals may vary due to rounding.
2018-19 E&G Revenue Other, 3.9% State Appropriation, 27.3% Tuition & Fees, 68.8%
2018-19 Expenditure Projections
E&G Expenditures (in millions) 2018-19 Proposed Budget 2017-18 Actual Change $71.21 $74.71 $3.50 Salaries & Benefits 20.61 21.56 .95 Non-Personnel Capital, Transfers & Debt Service 10.93 8.52 (2.41) $102.75 $104.79 $2.04 Total Expenditures Note: Totals may vary due to rounding.
E&G Salaries 35,000,000 30,000,000 25,000,000 20,000,000 15,000,000 10,000,000 5,000,000 - 2017-2018 Actual 2018-2019 Proposed Budget
2018-19 E&G Salaries & Benefits SCUPA, 4.64% All Other, 2.36% Non-Represented, 16.48% AFSCME, 18.47% APSCUF, 58.05% Note: Totals may vary due to rounding.
E&G Employee Benefits 12,000,000 10,000,000 8,000,000 6,000,000 4,000,000 2,000,000 - Healthcare Retirement Other Benefits 2017-18 Actual 2018-19 Proposed Budget
E&G Compensation Analysis 100% 90% 31.42% 30.56% 30.57% 31.43% 80% 70% 60% 50% 40% 68.58% 69.44% 69.43% 30% 68.57% 20% 10% 0% Actual 2015-16 Actual 2016-17 Actual 2017-18 Benefits Proposed 2018-19 Salaries
E&G Non-Personnel Expenditures (in millions) 2018-19 Proposed Budget 2017-18 Actual Change Operating Expenses $14.55 $14.64 $0.09 Student Aid 3.50 4.03 0.53 Foundation Support 1.13 1.13 0.00 Camps & Conferences 1.43 1.77 0.34 Total Expenditures $20.61 $21.57 $.96 Note: Totals may vary due to rounding.
E&G Non-Personnel Expenses 16,000,000 14,000,000 12,000,000 10,000,000 8,000,000 6,000,000 4,000,000 2,000,000 - Actual 2017-18 Proposed 2018-19
E&G Capital, Transfers & Debt Srvc (in millions) 2018-19 Proposed Budget 2017-18 Actual Change $ 2.92 Capital & Debt Svc $ 3.04 $0.12 8.01 Transfers 5.48 (2.53) $10.93 Total $ 8.52 $(2.41) Note: Totals may vary due to rounding.
2018-19 E&G Expenditures & Transfers Salaries & Benefits, 71.3% Capital Expenditures & Transfer, 8.1% Utilities, Services & Supplies, 16.7% Student Financial Aid, 3.9% Note: Totals may vary due to rounding.
2018-2019 University Operating Budget (All Funds)
2018-19 University Budget All Funds Educational & General, $104,798,030 72.5% 13.8% 13.6% Restricted, $20,015,234 Auxiliary, $19,710,874
2018-19 Total Revenue All Funds Students, $91,017,652 63.0% 13.9% 19.8% 3.3% Grants, $20,015,234 Other E&G, $4,832,114 Appropriation, $28,659,138
Undergraduate Full-time, In-State, Residential Student (Typical First-Year Student) Fees-Academic Year 2017-18 2018-19 Instructional ( 19 Warrior Promise) $ 8,706 $ 9,594 General Fees 1,238 1,244 Student Activity Fee 354 364 Room ( 18 Trad Dbl, 19 Suite Dbl) 6,000 7,700 Board 2,792 2,900 Total $19,090 $21,802 Annual dollar increase $2,712 Overall percent increase 14.2%
2018-19 Undergraduate Full-time, In-State, Residential Student (Typical First-Year Student) $35,000 $30,000 $5,050 $5,200 $4,094 $25,000 $7,250 $7,530 $8,896 $2,900 $20,000 $950 $1,038 $3,630 $890 $7,700 $15,000 $6,120 $10,000 $2,914 $18,130 $17,416 $16,080 $3,330 $5,000 $8,288 $6,240 $0 ESU Northampton $19,320 Temple $29,960 Pitt Penn State $31,184 $21,802 $31,380 Tuition Fees Room Board
Looking Ahead A. Collective Bargaining Agreements B. Enrollment C. Employee Benefit Cost D. Facility Infrastructure E. State Support

