Unlocking the Power of R for Statistical Analysis and Data Visualization
Discover the capabilities of R, a free, open-source statistical analysis software competing with commercial tools like SPSS and Excel. Learn about its architecture, packages, and key features for data analysis and visualization in various fields like data mining and machine learning.

Download Presentation

Please find below an Image/Link to download the presentation.
The content on the website is provided AS IS for your information and personal use only. It may not be sold, licensed, or shared on other websites without obtaining consent from the author. If you encounter any issues during the download, it is possible that the publisher has removed the file from their server.
You are allowed to download the files provided on this website for personal or commercial use, subject to the condition that they are used lawfully. All files are the property of their respective owners.
The content on the website is provided AS IS for your information and personal use only. It may not be sold, licensed, or shared on other websites without obtaining consent from the author.
E N D
Presentation Transcript
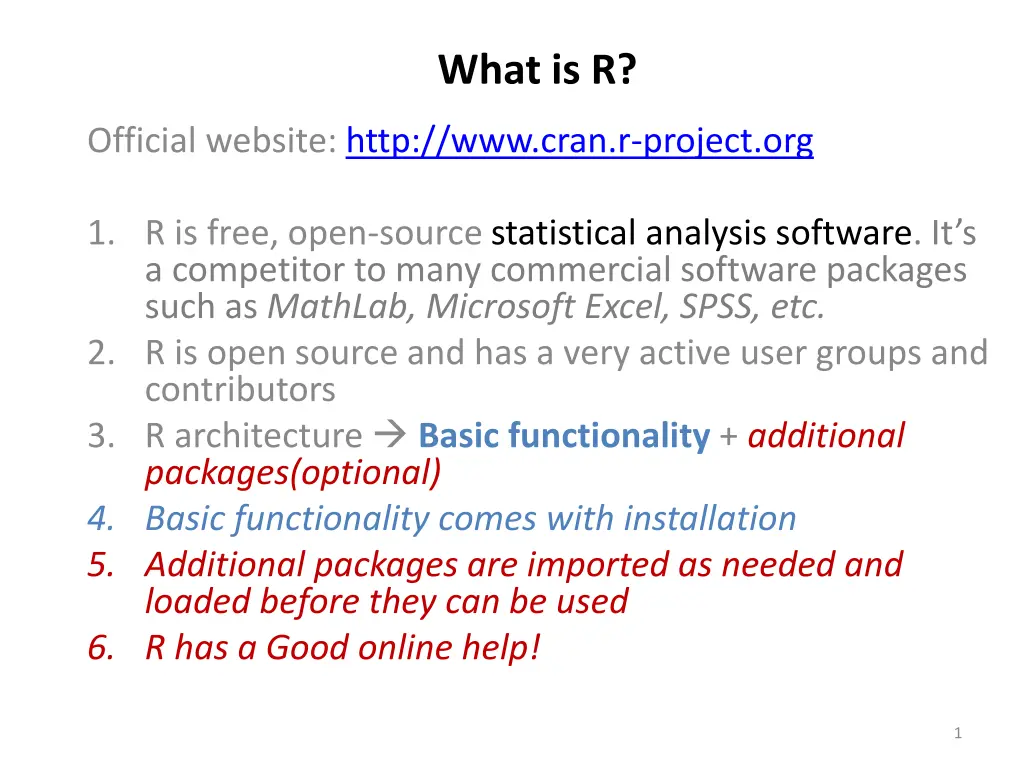
What is R? Official website: http://www.cran.r-project.org 1. R is free, open-source statistical analysis software. It s a competitor to many commercial software packages such as MathLab, Microsoft Excel, SPSS, etc. 2. R is open source and has a very active user groups and contributors 3. R architecture Basic functionality + additional packages(optional) 4. Basic functionality comes with installation 5. Additional packages are imported as needed and loaded before they can be used 6. R has a Good online help! 1
Example of Utility of R : Statistical Data Analysis & Data Visualization Exploratory data analysis When analyzing data in sciences (Data mining, Machine learning, Social Science, etc.) , most researchers use Ms Excel, MathLab, SPSS, etc. to store, edit, and analyze their data. For example, if researcher is studying students appraisal of a courses, he may have participants complete an online survey. The researcher might combine individual answers to create a global course score. Then, the next step would be to perform a statistical test to look for group differences among students on a particular course, or calculate correlations with other items of interest (Mean, median, correlation, standard deviation, etc.). Data visualization In many cases one would like to visualize the dataset R provides a great way to achieve the above objectives. 2
Basic structure of R R Basic Packages (Installation) Add-on Packages (Import) Usually located at C:/Program Files/R/R-2.15.1/library This location could be different depending on your particular installation Additional libraries are imported as needed Basic packages are available after installation. 3
Illustrating Few Key Features of R 1-Scatterplot s3d <-scatterplot3d(SepalWidth,PetalLength,SepalLength, pch=16, highlight.3d=TRUE, type="h", main="3D Iris Scatterplot") fit <- lm(SepalLength ~ SepalWidth+PetalLength) s3d$plane3d(fit) 3D Iris Scatterplot 8 PetalLength 7 SepalLength 7 6 6 5 4 5 3 2 1 4 2.0 2.5 3.0 3.5 4.0 4.5 SepalWidth 4
Scaterpolt scatter3d(SepalWidth,PetalLength,SepalLength,sphere.size=2, surface=TRUE, fit="linear",model.summary="TRUE", parallel=FALSE, elliposiod=TRUE,surface.col=c("green", "red", "blue", "gold", "firebrick3")) 5
2-Object manipulation/clustering analysis #Demonstrating k-mean clustering library(cluster) library(fpc) dataset = read.csv("C:/Users/paul/Desktop/R_wd/L ab/iris.csv") mysubSet<- dataset[1:4] obj<-kmeans(mysubSet,centers=3) 1 15 3 3 3 1 1 14 1 1 1 1 11 1 1 3 3 1 3 3 2 2 3 33 3 1 1 1 3 3 3 33 3 1 1 1 13 1 3 3 1 23 2 2 2 2 2 2 2 2 3 3 3 3 3 1 3 3 3 3 2 2 1 3 22 2 1 1 3 1 1 1 3 2 2 1 1 1 11 1 3 3 dc 2 12 1 1 1 1 1 2 2 2 2 2 2 2 2 1 1 2 2 2 2 2 2 3 3 2 1 1 2 22 2 2 1 1 1 1 1 2 3 11 2 2 2 2 2 2 2 2 1 2 2 2 2 22 3 #plot result plot(mysubSet,obj$cluster,pch=obj$cluste r) plotcluster(mysubSet,obj$cluster) #Clustering quality result obj$centers obj$totss obj$withinss obj$size 2 2 10 2 2 2 2 2 2 1 9 2 0 5 10 dc 1 7
Installation 1. Go to http://cran.r-project.org/mirrors.html. The R installations are distributed by the Comprehensive R Archive Network (CRAN). CRAN is a collection of sites which carry identical materials and were created as mirror sites to lessen the load on any one server. 2. Click on one of the USA links, select for example http://lib.stat.cmu.edu/R/CRAN/, which brings you to Carnegie Mellon University's Statlib mirror site. (Select a site close to where you are) 3. In the Download and Install R box, click on the `Windows' link. 4. Click on the `base' link. 5. Right-click on the `Download R 2.9.1 for Windows' link and choose `Save Link As. . . '. 6. Save the .exe _le to your Desktop (the R-2.9.1-win32.exe _le is R-3.0.1-win.exe approximately 36Mb 52 Mb). 7. Double-click on the .exe icon and follow the instructions. 8. When asked to `Select the components you want to install', choose the (default) `User' installation. Don't worry about `customizing the startup options'. In general, you should install R perfectly by just clicking on the `Okay', `Next', or `Finish' buttons at each step and letting the R set-up use the default choices. 9
Beginner reference http://cran.r-project.org/doc/manuals/R-intro.html#The-R-environment R is an interpreter. It is built with the S language Command line. You type the command and R executes it 10
Preliminaries R is case sensitive # is the comment tag R is installed with a default library/packages. You add/ import additional Packages to the library using the command library() To use a library function you must load it first into memory using the command load() Basic instructions are memory resident (you do not need to load them) Variable names cannot start with . (dot), + (plus sign) or - (minus sign) 11
Preliminaries No variable declaration is needed. Variables are called objects and are memory residents. Assignment is achieved with the command assign() For example: assign("x", c(10.4, 5.6, 3.1, 6.4, 21.7)) put the vector into x Symbol for assignment : <- ( this is a shortcut) To Print on screen just type the variable name followed by ENTER or use cat(), or print() Example A<-2 cat(A) will display 2 on the screen Command are separated by ; or by new line character Use the setwd command to set a working directory For example : setwd("C:/Documents and Settings/username/My Documents/xyz/") 12
Few Basic Commands help(topic) or help(help=topic) or ?topic In the command line if you type help(topic) R will fetch information about the topic you need help with. A topic is either an instruction or a package name For example, help() or help(help) will provide help about the help instruction example(topic) # will provide examples of how to use the instruction (topic) 13
q() to quit R. source(path) to execute several lines of instructions stored in a file (sometime better than interactive mode). Path: where is the path to the file. File containing R script have the extension .r For example Source (source1.r) will execute everything in the file assuming source1.r is in the working directory 14
source() is also available under the menu. (window) File>> Source R Code then select the file sink( outputFile) command will redirect all output to the outputFile. For example sink("record.lis") will output to record.lis sink() will restore the output back to the console. (no argument provided) 15
Data permanency and removing objects l() :To print the workspace on the console workspace :list of most objects currently in memory rm: (object names separated by commas) to remove one or more objects from the workspace You may use the File menu to save or load workspaces 16
Non interactive mode: R-editor You may use the R-editor to edit a script then run/save. (File >> New Script) 17
Non interactive mode: RCommander RCommander RCommander is an external R- editor package that needs to be imported Packages>> load packages scroll until you find Rcmdr 18
rCommander screen. You type your script here Here is the output window Compilation error/warning window 19
links 1-Official website: http://www.cran.r-project.org 2-Quick-R :To learn about graphics http://www.statmethods.net/graphs/ 3- Beginner reference http://cran.r-project.org/doc/manuals/R- intro.html#The-R-environment 20
THANK YOU! 21


 to quit R.")
 is also available under the menu.")