Unveiling Market Basket Analysis for Enhanced Profits
Explore the realm of computerized market basket analysis and association rules to uncover non-intuitive associations that can drive profits. Discover how this process works, from identifying data groups to real-world applications like fraud detection and intrusion systems. Learn about the Apriori algorithm and the principle of disregarding unimportant data in analysis. Dive into practical examples like grocery store buying patterns and network performance analysis, gaining insights into the importance of identifying significant data subsets.

Download Presentation

Please find below an Image/Link to download the presentation.
The content on the website is provided AS IS for your information and personal use only. It may not be sold, licensed, or shared on other websites without obtaining consent from the author.If you encounter any issues during the download, it is possible that the publisher has removed the file from their server.
You are allowed to download the files provided on this website for personal or commercial use, subject to the condition that they are used lawfully. All files are the property of their respective owners.
The content on the website is provided AS IS for your information and personal use only. It may not be sold, licensed, or shared on other websites without obtaining consent from the author.
E N D
Presentation Transcript
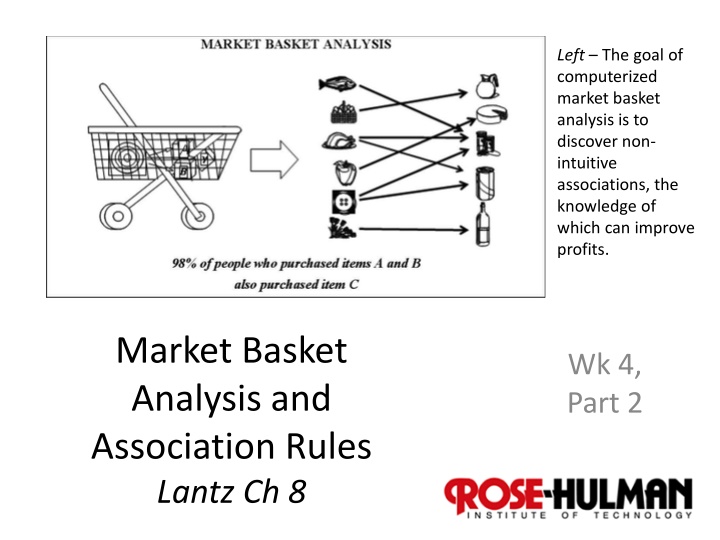
Left The goal of computerized market basket analysis is to discover non- intuitive associations, the knowledge of which can improve profits. Market Basket Analysis and Association Rules Lantz Ch 8 Wk 4, Part 2 1
How does it work? Usually, you need to have some way of identifying the groups you might want to separate? Like the ID s of the different products in a market basket analysis. If we don t have the concepts to use, the separation problem is much trickier. What if you don t have names for these 3 different groups of data? 2
The grocery store is a good example Practical to know more about buying patterns. Easy to picture underlying rationale: {peanut butter, jelly} {bread} Most often, searching for associations that will be used later for some purpose. A fishing expedition. Unsupervised learning. (No dependent variable, per se.) Humans eyeball the results for usefulness. 3
Typical example Fraud detection Where are unusual relationships repeated? E.g., Store associate X has a lot more cash voids than average, and Supervisor Y approves a high percentage of these. Voided transactions are a known source of opportunity crimes by retail clerks. Because liquid assets are handed out. 4
Another example Intrusion detection systems try to help the humans, who are monitoring a system, notice anomalies in the patterns: E.g., Pay-per-view movie rentals. Network security Ship movements Analyst s dilemma Is this normal ? 5
Basic principle ignore the unimportant In analyzing network performance, at AT&T, we mostly had to rule-out most of the data that devices might report. Like, how many errors does a network device have to throw off, in a certain period of time, before we care? Probably a lot! 6
The Apriori algorithm It uses prior beliefs about the properties of common itemsets. Like the analyst supplies logic and subject-matter experience to what they see. Subsets (e.g., associations) of data only deserve to be searched if the larger dataset is significant. [A, B] is only interesting to look at if [A] and [B] are both frequently occurring. 7
How to use Apriori Strengths Weaknesses Is ideally suited for working with very large amounts of transactional data. Not very helpful for small datasets. Results in rules that are easy to understand. Takes effort to separate the insight from common sense. Useful for data mining and discovering unexpected knowledge in databases. Easy to draw spurious conclusions from random patterns. 8
Measuring rule interest Apriori could come up with a huge number of proposed rules. Whether or not an itemset or rule is interesting is determined by: Support How frequently it occurs. Confidence Its predictive power or accuracy, like the Confidence that X leads to Y is the Support for X and Y occurring together, vs Support for just X. 9
What Apriori does Identify all the itemsets that meet a minimum Support threshold. In succeeding iterations, it combines itemsets that follow rules (like occurring together) with increasing levels of frequency. Create rules from these itemsets that meet a minimum Confidence threshold. At some point, it begins considering candidate rules like [A] [B], evaluated vs the threshold. 10
Lantzs example Frequently purchased groceries The lists in grocery.csv are varying length grocery transactions, listing items bought. Need a sparse matrix to put these items into! A column in each transaction for every item that might possibly appear. Lantz s data has 169 different items. A large Walmart typically has 1,000,000 items (though not that many different types of items). A sparse matrix is more memory efficient. 11
Preparing the data > library(arules) > groceries <- read.transactions("/Users/chenowet/Documents/ Rstuff/groceries.csv", sep = ",") > summary(groceries) transactions as itemMatrix in sparse format with 9835 rows (elements/itemsets/transactions) and 169 columns (items) and a density of 0.02609146 element (itemset/transaction) length distribution: sizes 1 2 3 4 5 6 7 8 9 10 11 12 13 14 15 16 17 2159 1643 1299 1005 855 645 545 438 350 246 182 117 78 77 55 46 29 18 19 20 21 22 23 24 26 27 28 29 32 14 14 9 11 4 6 1 1 1 1 3 1 most frequent items: whole milk other vegetables rolls/buns soda yogurt 2513 1903 1809 1715 1372 (Other) 34055 Min. 1st Qu. Median Mean 3rd Qu. Max. 1.000 2.000 3.000 4.409 6.000 32.000 includes extended item information - examples: labels 1 abrasive cleaner 2 artif. sweetener 3 baby cosmetics 12
Can inspect support for each item > itemFrequency(groceries[, 1:3]) abrasive cleaner artif. sweetener baby cosmetics 0.0035587189 0.0032536858 0.0006100661 > itemFrequencyPlot(groceries, support = 0.1) > itemFrequencyPlot(groceries, topN = 20) > image(groceries[1:5]) > image(sample(groceries,100)) See next 3 slides 13
Training a model on the data > apriori(groceries) Parameter specification: confidence minval smax arem aval originalSupport support minlen maxlen 0.8 0.1 1 none FALSE TRUE 0.1 1 10 target ext rules FALSE set of 0 rules Using default confidence and support 17
Whats a reasonable support level? Lantz argues that you can reason about this. E.g., if a pattern occurs in a grocery transaction twice a day, it may be interesting to us. The dataset represents 30 days of data. So, that would be 60 occurrences, out of the 9835 transactions represented. Or, 0.006 as a trial at the level of support needed. 18
Whats a reasonable confidence level? Lantz discusses batteries as an example. Set this too high, you ll only get the association with smoke detectors. Set this too low, you ll get every chance thing someone buys commonly, like celery. Goal probably is to know What to place next to the batteries. He guesses, start with 0.25 here, and then lower it if you are getting only obvious results. 19
Revised training model > groceryrules <- apriori(groceries, parameter = list(support = 0.006, confidence = 0.25, minlen = 2)) Parameter specification: confidence minval smax arem aval originalSupport support minlen maxlen 0.25 0.1 1 none FALSE TRUE 0.006 2 10 target ext rules FALSE set of 463 rules We got something this time! 20
More from the apriori call rule length distribution (lhs + rhs):sizes 2 3 4 150 297 16 Like, {peanut butter, jelly} {bread} is length 3. Min. 1st Qu. Median Mean 3rd Qu. Max. 2.000 2.000 3.000 2.711 3.000 4.000 summary of quality measures: support confidence lift Min. :0.006101 Min. :0.2500 Min. :0.9932 1st Qu.:0.007117 1st Qu.:0.2971 1st Qu.:1.6229 Median :0.008744 Median :0.3554 Median :1.9332 Mean :0.011539 Mean :0.3786 Mean :2.0351 3rd Qu.:0.012303 3rd Qu.:0.4495 3rd Qu.:2.3565 Max. :0.074835 Max. :0.6600 Max. :3.9565 Lift(X Y) = confidence(X Y) / support(Y) And, Lift(X Y) = Lift(Y X) 21
And what rules did we get? Actionable? Trivial? Inexplicable? > inspect(groceryrules[1:3]) lhs rhs support confidence lift 1 {potted plants} => {whole milk} 0.006914082 0.4000000 1.565460 2 {pasta} => {whole milk} 0.006100661 0.4054054 1.586614 3 {herbs} => {root vegetables} 0.007015760 0.4312500 3.956477 22
Improving model performance How about sorting these rules, to make them easier to analyze? More interesting? > inspect(sort(groceryrules, by = "lift") [1:5]) lhs rhs support confidence lift 1 {herbs} => {root vegetables} 0.007015760 0.4312500 3.956477 2 {berries} => {whipped/sour cream} 0.009049314 0.2721713 3.796886 3 {other vegetables, tropical fruit, whole milk} => {root vegetables} 0.007015760 0.4107143 3.768074 23
Or, How about taking subsets of the rules? > berryrules <- subset(groceryrules, items %in% "berries") > inspect(berryrules) lhs rhs support confidence lift 1 {berries} => {whipped/sour cream} 0.009049314 0.2721713 3.796886 2 {berries} => {yogurt} 0.010574479 0.3180428 2.279848 3 {berries} => {other vegetables} 0.010269446 0.3088685 1.596280 4 {berries} => {whole milk} 0.011794611 0.3547401 1.388328 24
Can save rules for future analysis, etc. > write(groceryrules, file = "/Users/chenowet/Documents/Rstuff/groceryrules.csv", sep = ",", quote = TRUE, row.names = FALSE) > groceryrules_df <- as(groceryrules, "data.frame") > str(groceryrules_df) 'data.frame': 463 obs. of 4 variables: $ rules : Factor w/ 463 levels "{baking powder} => {other vegetables}",..: 340 302 207 206 208 341 402 21 139 140 ... $ support : num 0.00691 0.0061 0.00702 0.00773 0.00773 ... $ confidence: num 0.4 0.405 0.431 0.475 0.475 ... $ lift : num 1.57 1.59 3.96 2.45 1.86 ... 25