Update on National HIV Behavioral Surveillance Study
This update provides insights into the BESURE study conducted in Baltimore, highlighting the assessment of HIV risk behaviors, testing behaviors, and use of prevention and care services among high-risk populations. The study spans multiple waves focusing on different risk groups such as MSM, IDU, and HET individuals. Recruitment methods and sample sizes are also detailed to provide a comprehensive overview of the study's objectives and findings.

Download Presentation

Please find below an Image/Link to download the presentation.
The content on the website is provided AS IS for your information and personal use only. It may not be sold, licensed, or shared on other websites without obtaining consent from the author.If you encounter any issues during the download, it is possible that the publisher has removed the file from their server.
You are allowed to download the files provided on this website for personal or commercial use, subject to the condition that they are used lawfully. All files are the property of their respective owners.
The content on the website is provided AS IS for your information and personal use only. It may not be sold, licensed, or shared on other websites without obtaining consent from the author.
E N D
Presentation Transcript
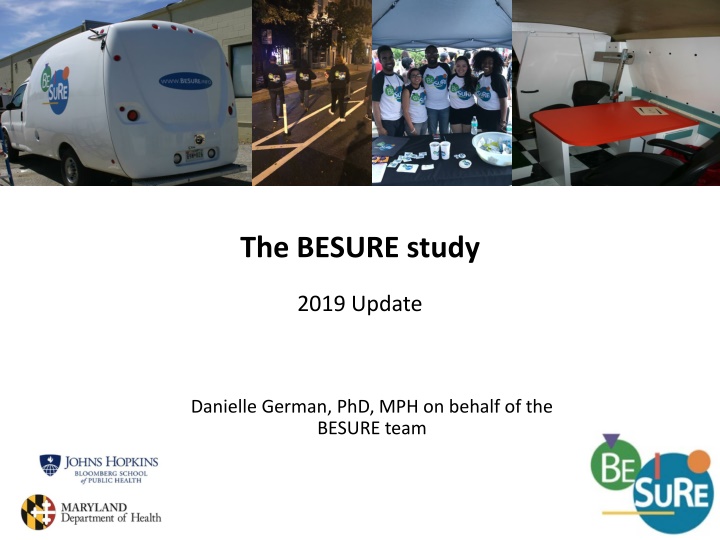
The BESURE study 2019 Update Danielle German, PhD, MPH on behalf of the BESURE team
Overview National HIV Behavioral Surveillance and BESURE Baltimore Data Overview HIV Cascade Indicators, All Waves IDU5 Data Update Upcoming HET5 Cycle
National HIV Behavioral Surveillance (NHBS) Implemented in up to 25 metropolitan areas (varied over time) Major divisions of metropolitan areas with greatest numbers of AIDS cases in the U.S.
Baltimore HIV Behavioral Surveillance The BEhavioral SUrveillance REsearch Study Collaborative project of CDC, MDH, and JHSPH
Objectives To assess prevalence of and trends in: HIV risk behaviors HIV testing behaviors Exposure to and use of prevention and care services among persons at high risk for infection or transmission HIV prevalence and annual survey on social issues, health, and well- being in Baltimore
BESURE to date Wave 1 Wave 2 Wave 3 Wave 4 Wave 5 2004-2005: MSM1 2008: MSM2 2011: MSM3 2014: MSM4 2017: MSM5 n=448 n=404 n=455 n=386 n=645 2006: IDU1 2009: IDU2 2012: IDU3 2015: IDU4 2018: IDU5 n=555 n=539 n=507 n=617 n=584 2007: HET1 2010: HET2 2013: HET3 2016: HET 4 2019: HET5 upcoming n=310 n=338 n=505 n=412
Recruitment methods Survey wave Population Recruitment 2004-2005 2008 2011 2014 2017 MSM Venue-based time location sampling 2006 2009 2012 2015 2018 IDU/PWID Respondent driven sampling 2007 HET Venue based time location sampling 2010 2013 2016 2019 HET Respondent driven sampling
Sample size 700 600 500 400 300 200 100 0 Round 1 (2005-2007) Round 2 (2008-2010) Round 3 (2011-2013) Round 4 (2014-2016) Round 5 (2017-2019) MSM IDU HET
HIV Prevalence 2004- 2018: MSM, IDU(PWID), HET
HIV prevalence: BESURE MSM waves 2004-2017 1.00 0.90 0.80 0.70 0.60 0.50 38% 43% 38% 36% 0.40 31% 0.30 0.20 0.10 0.00 2004-5 2008 2011 2014 2017
HIV prevalence: BESURE IDU/PWID waves 2006-2018 1.00 0.90 0.80 0.70 0.60 0.50 0.40 0.30 23% 16% 0.20 13% 12% 10% 0.10 0.00 2006 2009 2012 2015 2018
HIV prevalence: BESURE HET waves 2004-2016 1.00 0.90 0.80 0.70 0.60 0.50 0.40 0.30 0.20 7% 6% 4% 7% 0.10 0.00 2007 2010 2013 2016
HIV cascade indicators HIV testing behavior Ever tested for HIV Tested in the past 2 years Tested in the past year HIV diagnosis Positive test result Previously aware Newly diagnosed HIV care (among self-report) Ever provider Past year Taking ARV Virally suppressed (self-report) Self-reported viral suppression
Ever tested for HIV among all study participants 100 80 60 40 20 0 Round 1 (2005-2007) Round 2 (2008-2010) Round 3 (2011-2013) Round 4 (2014-2016) Round 5 (2017-2019) MSM IDU HET
Tested in the past two years among self-reported HIV-negative participants 100 80 60 40 20 0 Round 1 (2005-2007) Round 2 (2008-2010) Round 3 (2011-2013) Round 4 (2014-2016) Round 5 (2017-2019) MSM IDU HET
HIV positive test result among all participants 100 80 60 40 20 0 Round 1 (2005-2007) Round 2 (2008-2010) Round 3 (2011-2013) Round 4 (2014-2016) Round 5 (2017-2019) MSM IDU HET
Newly diagnosed among participants who tested positive 100 80 60 40 20 0 Round 1 (2005-2007) Round 2 (2008-2010) Round 3 (2011-2013) Round 4 (2014-2016) Round 5 (2017-2019) MSM IDU HET
Newly diagnosed among participants who tested positive MSM2-4, IDU3-4 are ART-adjusted 100 80 60 40 20 0 Round 1 (2005-2007) Round 2 (2008-2010) Round 3 (2011-2013) Round 4 (2014-2016) Round 5 (2017-2019) MSM IDU HET
Newly diagnosed among all participants MSM2-4, IDU3-4 are ART-adjusted 100 80 60 40 20 0 Round 1 (2005-2007) Round 2 (2008-2010) Round 3 (2011-2013) Round 4 (2014-2016) Round 5 (2017-2019) MSM IDU HET
Ever seen an HIV care provider among participants who reported an HIV diagnosis 100 80 60 40 20 0 Round 1 (2005-2007) Round 2 (2008-2010) Round 3 (2011-2013) Round 4 (2014-2016) Round 5 (2017-2019) MSM IDU HET Note: small overall n, especially in HET cycles
Seen an HIV care provider in the past year among participants who have seen provider 100 80 60 40 20 0 Round 1 (2005-2007) Round 2 (2008-2010) Round 3 (2011-2013) Round 4 (2014-2016) Round 5 (2017-2019) MSM IDU HET Dates are missing for IDU4 & HET4.
Taking antiretroviral medications among participants who reported an HIV diagnosis 100 80 60 40 20 0 Round 1 (2005-2007) Round 2 (2008-2010) Round 3 (2011-2013) Round 4 (2014-2016) Round 5 (2017-2019) MSM IDU HET
Viral suppression (undetectable*) among participants who reported an HIV diagnosis 100 80 60 40 20 0 Round 1 (2005-2007) Round 2 (2008-2010) Round 3 (2011-2013) Round 4 (2014-2016) Round 5 (2017-2019) MSM IDU HET * self-reported
Viral suppression (undetectable*) among participants who reported taking antiretroviral medications 100 80 60 40 20 0 Round 1 (2005-2007) Round 2 (2008-2010) Round 3 (2011-2013) Round 4 (2014-2016) Round 5 (2017-2019) MSM IDU HET * self-reported
BESURE IDU5 Data Update Socio-demographics and socio-behavioral indicators HIV prevalence by race/ethnicity, age, geography HIV drug-related risk behaviors STI & HCV testing and prevalence Selected local data
Socio-demographics and key indicators, BESURE PWID 2009-2018 Characteristic IDU2 (n=507) IDU3 (n=620) IDU4 (n=576) IDU5 (n=555) Race/ Ethnicity White, not Hispanic Black, not Hispanic Hispanic Other 16% 80% 1% 4% 7% 89% 1% 4% 19% 77% 1% 3% 40% 54% 1% 4% Age 18-24 25-34 35-44 45+ 1% 12% 23% 64% 1% 3% 82% 67% 1% 8% 18% 73% 2% 21% 16% 61% Sex Male Female Transgender 72% 27% 1% 67% 33% 1% 72% 28% 1% 70% 29% 1% Other 8% 92% 13% 87% 14% 86% 11% 89% Sexual identity Heterosexual or Straight
Socio-demographics and key indicators, BESURE IDU 2009-2018 Characteristic IDU2 (n=507) IDU3 (n=620) IDU4 (n=576) IDU5 (n=555) County of Residence Baltimore City Baltimore County Other County in MSA 96% 3% 1% 97% 2% 1% 94% 5% 1% 86% 13% 1% Education High school/GED or less College or some college 83% 17% 84% 16% 81% 19% 76% 24% Employment Unemployed Full or Part-time 46% 12% 41% 7% 53% 8% 61% 12% Median annual household income (mid-point) $5,000- $9,999 $5,000- $9,999 $5,000- $9,999 $5,000- $9,999
Socio-demographics and key indicators, BESURE PWID 2008-2017 Characteristic IDU2 (n=507) IDU3 (n=620) IDU4 (n=576) IDU5 (n=555) Health Insurance Insured 59% 85% 86% 92% Homelessness Past year Current 54% 31% 32% 14% 43% 26% 60% 35% Incarcerated* Past year 44% 23% 21% 22% Received money or goods in exchange for sex** Past year NA NA 28% 19% * In IDU2, the definition of homelessness included temporarily staying with friends or relatives. ** Transactional sex asked differently in different years: In IDU5 direct item in local survey while in IDU4 constructed from NHBS core survey items.
HIV prevalence by race/ethnicity: PWID 2006-2018 30% 25% 25% 20% 18% 17% 16% 16% 14% 14% 15% 10% 10% 10% 7% 7% 6% 5% 2% 0% 0% 0% 2006 2009 2012 2015 2018 NH Black NH White Other
HIV prevalence by gender: PWID 2006-2018 120% 100% 100% 100% 80% 60% 50% 40% 24% 23% 18% 20% 14% 13% 13% 11% 11% 11% 7% 0% 0% 0% 2006 2009 2012 2015 2018 Male Female Transgender The numbers of transgender participants has been low (n<5).
HIV prevalence by age: PWID 2006-2018 30% 24% 25% 23% 19% 20% 18% 16% 15% 15% 14% 14% 15% 10% 10% 9% 10% 6% 5% 3% 3% 2% 0 0 0 0 0% 2006 2009 2012 2015 2018 <24 25-34 35-44 45+
HIV prevalence by county: PWID 2006-2018 40% 36% 35% 30% 24% 25% 20% 17% 16% 14% 15% 12% 11% 10% 7% 5% 5% 3% 0% 0% 0% 0% 0% 0% 2006 2009 2012 2015 2018 Baltimore City Baltimore County Other county in MSA Very small proportion of participants outside of Baltimore City, especially prior to 2018
HIV drug related risk behaviors: PWID 2018 In the past 12 months, how often did you... Never Rarely About half the time Most of the time Always USE A NEW STERILE NEEDLE? (N=555) 1% 9% 26% 35% 29% 2% USE NEEDLES THAT SOMEONE ELSE HAD ALREADY INJECTED WITH? (N=187) 35.4% 0% 74% 19% 5% 59.4% USE COOKERS, COTTONS, OR WATER THAT SOMEONE ELSE HAD ALREADY USED? (N=329) 0% 56% 26% 13% 5% 40.4% USED DRUGS DIVIDED WITH A SYRINGE THAT SOMEONE HAD ALREADY INJECTED WITH? (N=224) 1% 65% 23% 9% 2% The last time you shared with [last injecting partner], did you know their HIV status? (n=376) 49% Yes 0% 10% 20% 30% 40% 50% 60% Among 67.7% who reported sharing any injection equipment in past year
PrEP: PWID 2018 among those who reported being HIV negative (n=512) 30.00% 28% 25.00% 20.00% 15.00% 10.00% 7% 5.00% 1% <1% 0.00% PrEP aware discussed PrEP with provider in past 12 months used PrEP in past 12 months used PrEP daily in past 12 months
PrEP: PWID 2018 among those who reported being HIV negative (n=512) among those aware of PrEP (n=141) 30% 25% 20% 28% YES 15% 10% 5% 72% NO 0% discussed PrEP with provider in past 12 months used PrEP in past 12 months used PrEP daily in past 12 months PrEP aware 6 participants reported taking PrEP in the past 12 months. 3 of those reported taking PrEP daily.
HCV testing (self-report): PWID 2018 90% 84% 80% 70% 60% 53% 47% 50% 40% 30% 20% 14% 10% 0% Ever tested for HCV Ever diagnosed with HCV (among those who reported having been tested, n=466) Yes No
HCV treatment: PWID 2018 90% 85% 80% 70% 57% 60% 50% 40% 33% 30% 20% 10% 10% 6% 6% 4% 0% Reported taking medication to treat HCV (among those diagnosed with HCV, n=245) Most recent HCV treatment experience (among those who took medication, n=82) Results of most recent course of treatment (among those who took full course, n=47) Yes Still taking treatment Completed full course Did not completing course Did not respond Responded but relapsed Virus cleared
Past year STI testing (self-report): PWID 2018 97% 100% 97% 98% 90% 80% 70% 70% 60% 50% 40% 27% 30% 20% 10% 3% 2% 2% 0% Tested for STIs Diagnosed with gonorrhea Diagnosed with chlamydia Diagnosed with syphilis Yes No
STI prevalence among 545 participants tested 1.3% chlamydia (n=7) 1.5% gonorrhea (n=8) 10 9 8 7 6 5 4 3 2 1 0 chlamydia gonorrhea
Past year injection frequency: PWID 2018 100% 90% 66% use n=368 94% use n=522 53% use n=296 25% use n=136 10% use n=55 80% 70% 60% 50% 40% 30% 20% 10% 0% Overall injection frequency Speedball (cocaine & heroin)* Heroin (by itself) Powder cocaine* Crack cocaine Methamphetamine* Never Once a week or less More than once a week Once a day More than once a day *Differed by county of residence in chi2 test (p<0.05)
When you first used those painkillers, how did you obtain the drug? Were you hooked on painkillers before you injected drugs for the very first time? 45% 40% 35% 30% 25% yes 40% 20% no 60% 15% 10% 5% 0% given Rx by doctor given by friend given by family given by someone else purchased from friend, family, dealer purchased from internet stole from friend, family other yes no among 233 participants who reported being hooked on painkillers before first injection
In the past 30 days, have you heard or suspected that drugs you were using were cut or laced with Fentanyl? 100% 90% 86% 80% 70% 60% 50% 40% 30% 20% 13% 10% 0% Yes No n=527
In the past 12 months, did you overdose on heroin or painkillers? By overdose, I mean if you passed out, turned blue, or stopped breathing from using drugs. In the past 12 months, when you injected drugs, how often was Narcan or Naloxone available to you in case of an overdose? It could have been yours or someone else s. 45% Overdose prevalence 39% 40% 35% 30% yes 34% 25% 22% 20% no 66% 15% 15% 12% 12% 10% 5% yes no 0% Never Rarely About half the time Most of the time Always among 511 participants who reported having heard of Narcan.
In the past 12 months, how many times have you used Narcan or Naloxone on yourself or someone else? among 511 participants who reported having heard of Narcan. 45% (n=232) reported 0 times 54% (n=275) reported between 1 and 31 times mean among those reporting at least 1 use=3.40 In the past 12 months, that is, since [current month] of last year, how many times have you seen someone overdose from heroin, fentanyl, or opioid painkillers? 17% (n=96) reported 0 times 77% (n=453) reported having witnessed between 1 and 300 opioid overdoses mean among those reporting witnessing at least one opioid overdose=7.08
Past year health care experience among PWID, BESURE 2018 100% 86% 90% 80% 70% 68% 70% 60% 50% 40% 30% 18% 20% 10% 0% Seen a doctor, nurse, or other health care provider Did not get needed health care because could not afford it ...have you avoided going to the doctor or other health care provider because you feared being stigmatized or judged by healthcare staff because of your injection drug use? ...have you felt that a doctor or other healthcare provider treated you poorly because you use drugs?
Received syringes from Syringe Service Program among PWID, BESURE 2018 70% 60% 50% 40% 64% 64% 30% 20% 10% 7% 0% rec'd syringes from a SSP (n=510) rec'd syringes from BNEP (BCHD) (n=527) rec'd syringes from another SSP (n=527) Among 92% who received new sterile syringe in past year
Syringe Exchange Services In the past year when trying to access needle exchange programs, how often have you faced each of the following? 60% 53% 53% 50% 45% 40% 30% 19% 20% 17% 17% 14% 11% 8% 8% 10% 6% 6% 6% 4% 3% 0% Needle exchange site was too far away when I needed it Needle exchange site was not available on the day or time that I needed it I did not know where I could find a needle exchange site Never Rarely About half the time Most of the time Always


")
")


:")

:")