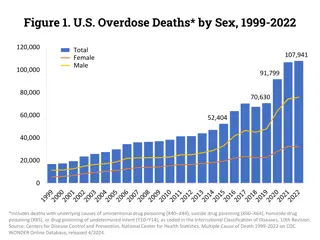
Update on Opioids and Public Health Initiatives
The update focuses on opioid use rates in Middlesex-London and Ontario, highlighting clean needle programs and opioid maintenance therapy. It also covers emergency department visit rates, inpatient hospitalization rates, and death rates due to acute drug toxicity. Additionally, the data includes admission rates for various substances presenting problems.

Download Presentation

Please find below an Image/Link to download the presentation.
The content on the website is provided AS IS for your information and personal use only. It may not be sold, licensed, or shared on other websites without obtaining consent from the author.If you encounter any issues during the download, it is possible that the publisher has removed the file from their server.
You are allowed to download the files provided on this website for personal or commercial use, subject to the condition that they are used lawfully. All files are the property of their respective owners.
The content on the website is provided AS IS for your information and personal use only. It may not be sold, licensed, or shared on other websites without obtaining consent from the author.
E N D
Presentation Transcript
Brief Update: Opioids January 4, 2017 CWDFM Christopher Mackie MD CCFP FRCPC Medical Officer of Health and CEO Middlesex-London Health Unit @Healthmac
Clean Needle Program 2.5 million clean needles/syringes per year
Rates of opioid users, Middlesex-London and Ontario, 2009-2012 2500 2000 Rate (per 10,000) 1500 1000 500 0 Opioid Maintenance Therapy Users All population Ages 0 - 24 Ages 25 - 44 Ages 45 - 64 Ages 65+ Middlesex-London 1966 549 1765 2215 2130 178 Ontario 2054 625 1956 2379 2173 103 Source: ODPRN, 2015
Legend: Op=Opioids Ca=Cannabinoids Co=Cocaine and stimulants Sed=Sedatives and Hypnotics Hall=Hallucinogens and solvents 130.0 120.0 110.0 100.0 Emergency department visit rate 90.0 per 100,000 population 80.0 70.0 60.0 50.0 40.0 30.0 20.0 10.0 0.0 2008 83.6 55.6 17.2 19.9 54.6 46.4 46.8 2009 107.1 68.3 17.9 18.6 31.4 30.9 47.8 2010 114.2 72.7 19.9 22.8 33.1 31.9 42.3 2011 112.4 77.7 26.1 28.6 40.9 33.2 41.5 2012 99.8 77.0 28.5 31.9 38.4 34.8 39.2 Op-ML Op-ON Ca-ML Ca-ON Co-ML Co-ON Sed-ML
Legend: Op=Opioids Ca=Cannabinoids Co=Cocaine and stimulants Sed=Sedatives and hypnotics Hall=Hallucinogens and solvents 60.0 50.0 40.0 Inpatient hospitalization rate per 100,000 population 30.0 20.0 10.0 0.0 2008 34.8 21.7 9.1 7.3 10.9 2009 39.6 24.2 13.1 7.4 11.1 2010 36.6 25.2 12.5 8.7 9.2 2011 40.2 29.2 12.2 9.8 12.8 2012 49.6 32.9 14.2 11.2 14.4 Op-ML Op-ON Ca-ML Ca-ON Co-ML
12.0 Legend: PO=Prescription Opioids 10.0 Death rate due to acute drug toxicity 8.0 per 100,000 population 6.0 4.0 2.0 0.0 2008 4.0 2.7 2009 4.9 3.4 2010 4.4 3.6 2011 2.8 3.8 2012 8.8 4.1 PO Deaths- ML PO Deaths- ON
600.0 Legend: PO=Prescription opioids Meth=Methamphetamines Benzo=Benzodiazepines OTC CP=Over-the-counter codeine presparations Hall=Hallucinogens Admission rates for presenting problem substances 500.0 per 1,000 individuals admitted 400.0 300.0 200.0 100.0 0.0 Heroin/ Opium 24.1 65.3 Cannabis PO Meth Cocaine Stimulants Benzo OTC CP Ecstasy Hall ML ON 486.6 536.0 430.1 308.6 251.9 73.1 212.7 288.5 99.8 51.8 25.5 60.8 12.4 22.3 11.7 22.0 6.2 12.9
Human Immunodeficiency Virus (HIV) Reported count and rate of Hepatitis C in Middlesex- London and Ontario (2006-2016) 50 12 10 40 Rate (per 100,000) 8 30 Count 6 20 4 10 2 0 0 2006 2007 2008 2009 2010 2011 2012 2013 2014 2015 2016 MLHU Count MLHU Rate Ontario rate Source: Public Health Ontario Query (August 31, 2016)
Hepatitis C (HCV) Reported count and rate of Hepatitis C in Middlesex- London and Ontario (2006-2016) 300 70 60 250 Rate (per 100,000) 50 200 40 Count 150 30 100 20 50 10 0 0 2006 2007 2008 2009 2010 2011 2012 2013 2014 2015 2016 MLHU Count MLHU Rate Ontario Rate excluding MLHU Source: Public Health Ontario Query (August 31, 2016)
iGAS Disease Number and percentage of confirmed MLHU iGAS cases identifying IDU as a risk factor by year (2010-2016) 40 45.0% 40.0% 35 35.0% 30 30.0% 25 25.0% 25 20 18 19 20.0% 15 21 15.0% 17 15 11 10 10.0% 11 5 5.0% 9 9 7 5 4 3 0 0.0% 2010 2011 2012 2013 2014 2015 2016 # IDU Cases # Other Risk Factors % IDU Cases
Endocarditis IVDU-Related Endocarditis Admissions at LHSC 120 113 100 80 73 64 60 52 40 31 23 20 0 2009 2011 2014 # of Patients # of Admissions Source: Courtesy Dr. Koivu & Dr. Silverman, LHSC
HIV Classified as a Public Health Emergency in Middlesex-London As of September 16th, Public Health Ontario data indicate there have been 45 new diagnoses of HIV in Middlesex-London in 2016, surpassing the total number of cases diagnosed in all of 2015 (42). New cases continue to be reported at a rate of one to two per week.
Current Action Fentanyl Patch-for-Patch Naloxone Program Community Drug and Alcohol Strategy (Middlesex and London) HIV Strategy Provincial opioid strategy CPSO and prescribing guidelines


")
")