US Health Care Spending Discrepancy Compared to Global Trends
Discover how the US stands out in health care spending, allocating a significantly higher percentage of GDP towards health compared to other countries. The data highlights the disparity in per capita spending on health care, government health insurance coverage, and the lack of universal health coverage in the US compared to other high-income nations.

Download Presentation

Please find below an Image/Link to download the presentation.
The content on the website is provided AS IS for your information and personal use only. It may not be sold, licensed, or shared on other websites without obtaining consent from the author. If you encounter any issues during the download, it is possible that the publisher has removed the file from their server.
You are allowed to download the files provided on this website for personal or commercial use, subject to the condition that they are used lawfully. All files are the property of their respective owners.
The content on the website is provided AS IS for your information and personal use only. It may not be sold, licensed, or shared on other websites without obtaining consent from the author.
E N D
Presentation Transcript
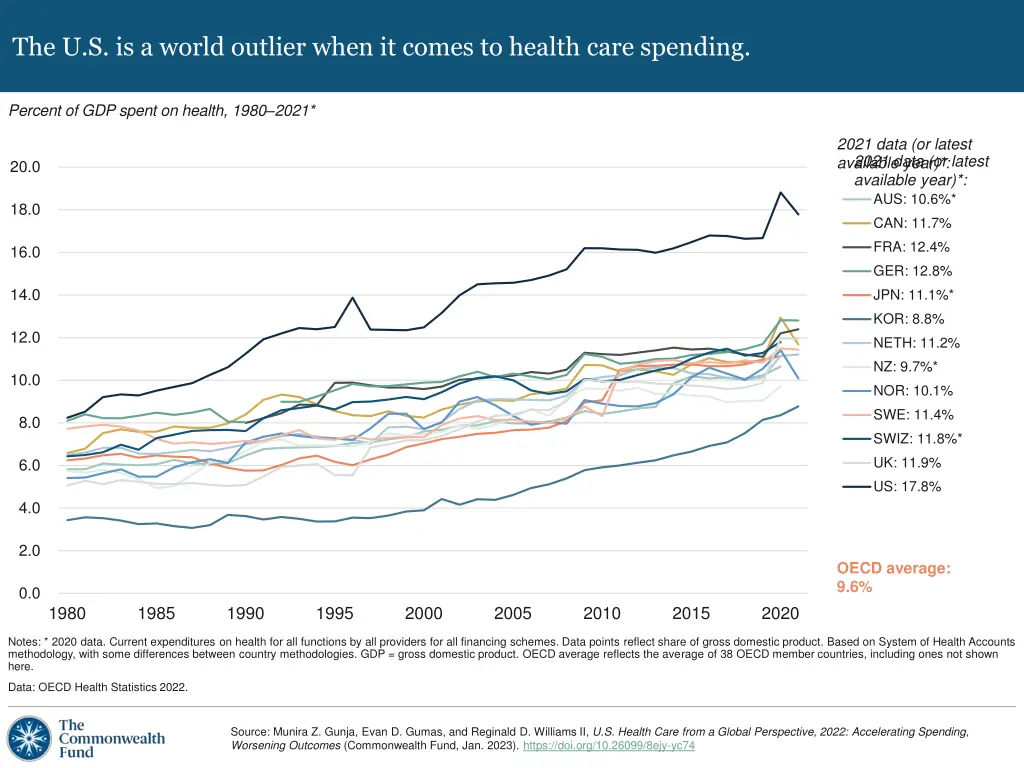
The U.S. is a world outlier when it comes to health care spending. Percent of GDP spent on health, 1980 2021* 2021 data (or latest available year)*: 2021 data (or latest available year)*: 20.0 AUS: 10.6%* 18.0 CAN: 11.7% FRA: 12.4% 16.0 GER: 12.8% 14.0 JPN: 11.1%* KOR: 8.8% 12.0 NETH: 11.2% NZ: 9.7%* 10.0 NOR: 10.1% SWE: 11.4% 8.0 SWIZ: 11.8%* UK: 11.9% 6.0 US: 17.8% 4.0 2.0 OECD average: 9.6% 0.0 1980 1985 1990 1995 2000 2005 2010 2015 2020 Notes: * 2020 data. Current expenditures on health for all functions by all providers for all financing schemes. Data points reflect share of gross domestic product. Based on System of Health Accounts methodology, with some differences between country methodologies. GDP = gross domestic product. OECD average reflects the average of 38 OECD member countries, including ones not shown here. Data: OECD Health Statistics 2022. Source: Munira Z. Gunja, Evan D. Gumas, and Reginald D. Williams II, U.S. Health Care from a Global Perspective, 2022: Accelerating Spending, Worsening Outcomes (Commonwealth Fund, Jan. 2023). https://doi.org/10.26099/8ejy-yc74 https://doi.org/10.26099/8ejy-yc74
The U.S. spends three to four times more on health care than South Korea, New Zealand, and Japan. Dollars (USD) per capita spend on health expenditures Government/compulsory + Voluntary Household out-of-pocket $1,225 $858 $993 $625 $1,577 $841 $744 $10,687 $489 $754 $663 $621 $505 $1,040 $6,524 $6,128 $6,072 $5,602 $5,421 $5,161 $4,980 $4,725 $4,709 $4,045 $3,888 $2,874 KOR NZ JPN UK AUS FRA CAN SWE NETH NOR SWIZ GER US Notes: Data reflects all financing schemes on all functions of current expenditures on health by all providers. The OECD considers the vast majority of ACA marketplace plans in US to be government/compulsory spending because of the individual mandate, despite its repeal in 2018. See here for more information: https://www.oecd.org/health/Spending-on-private-health-insurance- Brief-March-2022.pdf. Government/compulsory spending data: 2021 data for CAN, GER, KOR, NETH, NOR, SWE, and UK; 2020 data for AUS, FRA, JPN, NZ, SWIZ, and US. Voluntary spending data: 2021 data for CAN, GER, KOR, NETH, NOR, SWE, and UK. 2020 data for FRA, JPN, SWIZ, and US; 2019 data for AUS; 2018 data for NZ. Household out-of-pocket spending data: 2021 data for CAN, GER, KOR, NETH, NOR, SWE, UK, and US; 2020 data for FRA, JPN, and SWIZ; 2019 data for AUS; 2018 data for NZ. Data: OECD Health Statistics 2022. Source: Munira Z. Gunja, Evan D. Gumas, and Reginald D. Williams II, U.S. Health Care from a Global Perspective, 2022: Accelerating Spending, Worsening Outcomes (Commonwealth Fund, Jan. 2023). https://doi.org/10.26099/8ejy-yc74 https://doi.org/10.26099/8ejy-yc74
The U.S. is the only high-income country that does not guarantee health coverage. Percent of total population with health insurance coverage Government/compulsory health insurance Voluntary health insurance 100.0 100.0 100.0 100.0 100.0 100.0 100.0 100.0 100.0 99.9 99.9 99.9 96.1 83.2 72.2 68.0 62.0 54.3 38.1 28.5 28.1 25.8 10.3 UK GER NZ SWIZ AUS US CAN KOR NETH FRA JPN NOR SWE Notes: Government/compulsory health insurance data: 2021 data for AUS, CAN, FRA, NZ, and NOR; 2020 data for GER, KOR, NETH, SWE, SWIZ, UK, and US; 2019 data for JPN. Voluntary health insurance coverage data: 2021 data for AUS, CAN, and NZ; 2020 data for GER, KOR, NETH, and US; 2019 data for UK; 2017 data for FRA and SWIZ. Government health insurance refers to public benefit basket covering a minimum set of health services. Voluntary health insurance refers to payments for private insurance premiums, which grant coverage for services from private providers. See more information on definitions here: https://www.oecd.org/health/Spending-on-private-health-insurance-Brief-March-2022.pdf. Data: OECD Health Statistics 2022. Source: Munira Z. Gunja, Evan D. Gumas, and Reginald D. Williams II, U.S. Health Care from a Global Perspective, 2022: Accelerating Spending, Worsening Outcomes (Commonwealth Fund, Jan. 2023). https://doi.org/10.26099/8ejy-yc74 https://doi.org/10.26099/8ejy-yc74
U.S. life expectancy at birth is three years lower than the OECD average. Years expected to live, 1980 2021* 2021 data (or latest available year)*: 86 AUS: 83.2* CAN: 81.7* 82 FRA: 82.5 GER: 80.9 JPN: 84.7* 78 KOR: 83.5* NETH: 81.5 NZ: 82.3* 74 NOR: 83.2 SWE: 83.2 SWIZ: 84.0 70 UK: 80.4* US: 77.0* 66 OECD average: 80.4 62 1980 1985 1990 1995 2000 2005 2010 2015 2020 Note: * 2020 data. Total population at birth. OECD average reflects the average of 38 OECD member countries, including ones not shown here. Because of methodological differences, JPN and UK data points are estimates. Data: OECD Health Statistics 2022. Source: Munira Z. Gunja, Evan D. Gumas, and Reginald D. Williams II, U.S. Health Care from a Global Perspective, 2022: Accelerating Spending, Worsening Outcomes (Commonwealth Fund, Jan. 2023). https://doi.org/10.26099/8ejy-yc74 https://doi.org/10.26099/8ejy-yc74
Avoidable deaths per 100,000 population in the U.S. are higher than the OECD average. Avoidable deaths per 100,000 population (standardized rates), 2000 2020* 2020 data (or latest available year)*: 400 AUS: 144 350 CAN: 171* FRA: 164* GER: 195 300 JPN: 137* KOR: 147* 250 NETH: 161 NZ: 179* 200 NOR: 156* SWE: 150* 150 SWIZ: 130* UK: 194* US: 336 100 50 OECD average: 225 0 2000 2005 2010 2015 2020 Notes: Rates reflect age-standardized rates. Avoidable mortality includes deaths which are preventable and treatable. * 2019 data for CAN, JPN, KOR, and UK; 2018 data for SWE and SWIZ; 2016 data for FRA, NZ, and NOR. Data: OECD Health Statistics 2022. Source: Munira Z. Gunja, Evan D. Gumas, and Reginald D. Williams II, U.S. Health Care from a Global Perspective, 2022: Accelerating Spending, Worsening Outcomes (Commonwealth Fund, Jan. 2023). https://doi.org/10.26099/8ejy-yc74 https://doi.org/10.26099/8ejy-yc74
The U.S. has the highest rate of infant and maternal deaths. Infant mortality, deaths per 1,000 live births Maternal mortality, deaths per 100,000 live births 23.8 5.4 4.5 4.3 OECD average: 4.1 3.8 3.6 3.6 13.6 3.13.2 3.2 11.8 2.5 2.4 OECD average: 9.8 8.4 1.8 7.6 7.0 7.0 1.6 6.5 3.7 3.6 2.7 2.0 1.2 Notes: Infant mortality rates reflect no minimum threshold or gestation period or birthweight. Infant mortality 2021 data for FRA and SWIZ; 2020 data for AUS, CAN, GER, JPN, KOR, NETH, NOR, SWE, UK, and US; 2018 data for NZ. Maternal mortality 2020 data for AUS, CAN, GER, JPN, KOR, NETH, NOR, SWE, and US; 2019 data for SWIZ; 2018 data for NZ, 2017 data for UK; 2015 data for FRA. OECD average reflects the average of 38 OECD member countries. Data: OECD Health Statistics 2022. Source: Munira Z. Gunja, Evan D. Gumas, and Reginald D. Williams II, U.S. Health Care from a Global Perspective, 2022: Accelerating Spending, Worsening Outcomes (Commonwealth Fund, Jan. 2023). https://doi.org/10.26099/8ejy-yc74 https://doi.org/10.26099/8ejy-yc74
Rates of suicide were highest in the U.S., Japan, and South Korea. Intentional self-harm deaths per 100,000 population (standardized rates) 24.1 14.6 14.1 OECD average: 11.1 12.1 11.8 12.3 11.1 12.4 12.4 10.5 10.0 9.7 8.4 UK GER NETH CAN SWIZ NOR NZ FRA SWE AUS US JPN KOR Notes: Rates reflect age-standardized rates. Intentional self-harm death rates 2020 data for AUS, GER, KOR, NETH, UK, and US; 2019 data for CAN, JPN, and SWIZ; 2018 data for SWE; 2017 data for FRA; 2016 data for NZ and NOR. OECD average reflects the average of 38 OECD member countries, including ones not shown here. Data: OECD Health Statistics 2022. Source: Munira Z. Gunja, Evan D. Gumas, and Reginald D. Williams II, U.S. Health Care from a Global Perspective, 2022: Accelerating Spending, Worsening Outcomes (Commonwealth Fund, Jan. 2023). https://doi.org/10.26099/8ejy-yc74 https://doi.org/10.26099/8ejy-yc74
Deaths from assault are highest in the U.S. Mortality from assault, deaths per 100,000 population (standardized rates) 7.4 OECD average: 2.7 1.3 1.0 1.0 0.4 0.4 0.4 0.9 0.3 0.2 0.7 0.6 0.6 JPN UK FRA GER SWIZ NETH NOR KOR AUS CAN SWE NZ US Notes: Rates reflect age-standardized rates. Mortality from assault rates 2020 data for AUS, GER, KOR, NETH, UK, and US; 2019 data for CAN, JPN, and SWIZ; 2018 data for SWE; 2017 data for FRA; 2016 data for NZ, and NOR. OECD average reflects the average of 38 OECD member countries, including ones not shown here. Definition of what includes assault can be found here: https://icd.who.int/browse10/2019/en#/X85-Y09. Data: OECD Health Statistics 2022. Source: Munira Z. Gunja, Evan D. Gumas, and Reginald D. Williams II, U.S. Health Care from a Global Perspective, 2022: Accelerating Spending, Worsening Outcomes (Commonwealth Fund, Jan. 2023). https://doi.org/10.26099/8ejy-yc74 https://doi.org/10.26099/8ejy-yc74
The U.S. obesity rate is nearly double the OECD average. Percent of total population that is obese 42.8 34.3 30.4 OECD average: 25.0 28.0 24.3 23.6 15.6 14.4 13.4 13.0 11.3 7.4 4.6 JPN KOR SWIZ NOR NETH SWE FRA GER CAN UK AUS NZ US Notes: Obese defined as body-mass index of 30 kg/m or more. Data reflect rates based on measurements of height and weight, except NETH, NOR, SWE, SWIZ, for which data are self-reported. (Self-reported rates tend to be lower than measured rates.) 2021 data for NZ; 2020 data for KOR, NETH, and SWE; 2019 data for CAN, JPN, NOR, UK, and US; 2017 data for AUS, FRA, and SWIZ; 2012 data for GER. OECD average reflects the average of 23 OECD member countries, including ones not shown here, which provide data on obesity rates. Data: OECD Health Statistics 2022. Source: Munira Z. Gunja, Evan D. Gumas, and Reginald D. Williams II, U.S. Health Care from a Global Perspective, 2022: Accelerating Spending, Worsening Outcomes (Commonwealth Fund, Jan. 2023). https://doi.org/10.26099/8ejy-yc74 https://doi.org/10.26099/8ejy-yc74
Adults in the U.S. are the most likely to have multiple chronic conditions. Percent of adults age 18 and older who have multiple chronic conditions 30.4 25.9 25.6 22.4 20.8 20.0 19.8 19.2 18.5 18.1 17.0 FRA* SWIZ* NETH* SWE* NZ* GER* NOR* UK* CAN* AUS* US Notes: Chronic disease burden defined as adults age 18 years and older who have ever been told by a doctor that they have two or more of the following chronic conditions: asthma or chronic lung disease; cancer; depression, anxiety or other mental health condition; diabetes; heart disease, including heart attack; or hypertension/high blood pressure. Data reflect 11 countries which take part in the Commonwealth Fund's International Health Policy Survey. * Statistically significant differences compared to US or comparator bar at p<.05 level. Data: Commonwealth Fund International Health Policy Survey, 2020. Source: Munira Z. Gunja, Evan D. Gumas, and Reginald D. Williams II, U.S. Health Care from a Global Perspective, 2022: Accelerating Spending, Worsening Outcomes (Commonwealth Fund, Jan. 2023). https://doi.org/10.26099/8ejy-yc74 https://doi.org/10.26099/8ejy-yc74
The U.S. has the highest rate of death because of COVID-19. Deaths per 1 million because of COVID-19 3,253.4 3,183.0 2,413.0 2,146.6 1,969.0 1,628.9 1,314.0 1,301.1 913.3 679.6 638.0 510.9 470.0 NZ JPN KOR AUS NOR CAN NETH SWIZ GER SWE FRA UK US Notes: Rate per 1 million people who have died from COVID-19 since January 22, 2020. Available data as of January 18, 2023. Data: Our World in Data. Source: Munira Z. Gunja, Evan D. Gumas, and Reginald D. Williams II, U.S. Health Care from a Global Perspective, 2022: Accelerating Spending, Worsening Outcomes (Commonwealth Fund, Jan. 2023). https://doi.org/10.26099/8ejy-yc74 https://doi.org/10.26099/8ejy-yc74
The U.S. has among the lowest rates of physician visits and practicing physicians. Physician consultations in all settings per capita Practicing physicians per 1,000 population 14.7 12.4 9.5 8.4 OECD average: 5.7 6.6 5.2 4.5 6.1 4.5 4.3 5.0 OECD average: 3.7 4.3 4.0 3.9 3.9 3.8 3.8 3.5 3.2 3.2 2.8 2.6 2.6 2.5 2.2 Notes: Data for UK not available. 2021 data for AUS and NOR; 2020 data for FRA, GER, KOR, NETH, and SWE; 2019 data for CAN and JPN; 2017 for NZ and SWIZ; 2011 data for US. OECD average reflects the average of 37 OECD member countries, including ones not shown here. Notes: 2021 data for CAN, GER, NZ, NOR, SWIZ, and UK; 2020 data for AUS, FRA, JPN, KOR, and NETH; 2019 data for SWE and US. OECD average reflects the average of 31 OECD member countries, including ones not shown here. Data: OECD Health Statistics 2022. Data: OECD Health Statistics 2022. Source: Munira Z. Gunja, Evan D. Gumas, and Reginald D. Williams II, U.S. Health Care from a Global Perspective, 2022: Accelerating Spending, Worsening Outcomes (Commonwealth Fund, Jan. 2023). https://doi.org/10.26099/8ejy-yc74 https://doi.org/10.26099/8ejy-yc74
Hospital stays are shortest in the Netherlands and the U.S. The U.S. has among the lowest number of hospital beds. Average length of stay for inpatient care (days) Number of total hospital beds per 1,000 population 12.6 12.7 19.1 7.8 5.7 OECD average: 4.3 OECD average: 7.3 9.1 8.7 4.5 8.2 8.2 3.8 6.6 6.3 3.4 5.4 5.3 2.9 5.2 2.8 2.7 4.8 2.6 4.5 2.3 2.1 Notes: Data reflect average length of stay for inpatient care for all hospitals. 2021 data for NOR; 2020 data for CAN, FRA, GER, KOR, NETH, SWE, and SWIZ. 2019 data for AUS and NZ; 2018 data for UK; 2010 data for US. Data for JPN not available. OECD average reflects the average of 36 OECD member countries, including ones not shown here, where data are available. Notes: 2021 data for NZ and UK; 2020 data for CAN, FRA, GER, JPN, KOR, NETH, NOR, SWE, and SWIZ; 2019 data for US; 2016 data for AUS. OECD average reflects the average of 38 OECD member countries, including ones not shown here, with available data. Data: OECD Health Statistics 2022. Data: OECD Health Statistics 2022. Source: Munira Z. Gunja, Evan D. Gumas, and Reginald D. Williams II, U.S. Health Care from a Global Perspective, 2022: Accelerating Spending, Worsening Outcomes (Commonwealth Fund, Jan. 2023). https://doi.org/10.26099/8ejy-yc74 https://doi.org/10.26099/8ejy-yc74
The U.S. has a higher influenza vaccination rate compared to the OECD average, but its COVID-19 vaccination rate is still lower than that of many peer nations. Percent of adults age 65 and older immunized for influenza Percent of population fully vaccinated for COVID-19 81 Global average: 69 86 83 83 83 72 OECD average: 51.5 80 78 69 76 68 75 68 75 66 66 72 65 62 69 69 68 60 60 47 46 Notes: Total number of people who are fully vaccinated, relative to the total population. Available data as of January 18, 2023. Notes: Flu immunization rates reflect age-standardized rates. 2021 data for AUS, NZ, and NOR; 2020 data for CAN, FRA, GER, JPN, KOR, NETH, SWE, UK, and US; 2010 data for SWIZ. OECD average reflects the average of 37 OECD member countries, including ones not shown here, where data are available. Data: Our World in Data 2023. Data: OECD Health Statistics 2022. Source: Munira Z. Gunja, Evan D. Gumas, and Reginald D. Williams II, U.S. Health Care from a Global Perspective, 2022: Accelerating Spending, Worsening Outcomes (Commonwealth Fund, Jan. 2023). https://doi.org/10.26099/8ejy-yc74 https://doi.org/10.26099/8ejy-yc74
The U.S. has among the highest rates of screening for breast and colorectal cancers. Percent of females ages 50 69 screened for breast cancer Percent of population ages 50 74 screened for colorectal cancer 95 72 68 77 74 59 70 66 OECD average: 44 63 63 OECD average: 54.6 44 44 60 50 50 49 45 35 43 29 20 Notes: 2020 data for FRA, KOR, and NETH; 2019 data for AUS, CAN, JPN, and US; 2018 data for GER. Programmatic data for all countries except survey data for JPN and US. OECD average reflects the average of 17 OECD member countries, including ones not shown here, who provide colorectal cancer program data. Data not available for NOR, NZ, SWE, SWIZ, and UK. Notes: 2021 data for NZ and NOR; 2020 data for AUS, FRA, KOR, NETH, and UK; 2019 data for CAN, GER, JPN, SWE, and US; 2017 data for SWIZ. Programmatic data for all countries except survey data for JPN, SWE, SWIZ, and US. OECD average reflects the average of 27 OECD member countries, including ones not shown here, who provide breast cancer program data. Data: OECD Health Statistics 2022. Data: OECD Health Statistics 2022. Source: Munira Z. Gunja, Evan D. Gumas, and Reginald D. Williams II, U.S. Health Care from a Global Perspective, 2022: Accelerating Spending, Worsening Outcomes (Commonwealth Fund, Jan. 2023). https://doi.org/10.26099/8ejy-yc74 https://doi.org/10.26099/8ejy-yc74
MRIs are most common in Norway and Germany; the U.S. performs MRIs more frequently compared to the OECD average. Magnetic resonance imaging (MRI) scans per 1,000 population 149.9 133.2 122.8 112.3 107.6 OECD average: 80.1 71.7 62.0 58.6 56.8 AUS NETH CAN KOR US JPN FRA NOR GER Notes: 2021 data for AUS, NOR, and US; 2020 data for GER, KOR, and NETH; 2019 data for CAN and FRA; 2014 data for JPN. OECD average reflects the average of 28 OECD member countries, including ones not shown here, which provide data on MRI exam scans. Data not available for NZ, SWE, SWIZ, and UK. Data: OECD Health Statistics 2022. Source: Munira Z. Gunja, Evan D. Gumas, and Reginald D. Williams II, U.S. Health Care from a Global Perspective, 2022: Accelerating Spending, Worsening Outcomes (Commonwealth Fund, Jan. 2023). https://doi.org/10.26099/8ejy-yc74 https://doi.org/10.26099/8ejy-yc74
The U.S. has among the highest rates of hip replacements, right behind Switzerland. Inpatient hip replacement procedures per 1,000 population age 65 and older 16.4 15.6 14.2 13.5 13.3 OECD average: 9.4 10.6 10.4 10.2 7.5 5.2 3.8 KOR UK CAN SWE NZ FRA NETH GER NOR US SWIZ Notes: 2021 data for NOR. 2020 data for CAN, FRA, GER, KOR, SWE, SWIZ, and UK; 2019 data for NETH and NZ; 2010 data for US. OECD average reflects the average of 32 OECD member countries, including ones not shown here, which provide data on hip replacement procedures. Data not available for AUS and JPN. Data: OECD Health Statistics 2022. Source: Munira Z. Gunja, Evan D. Gumas, and Reginald D. Williams II, U.S. Health Care from a Global Perspective, 2022: Accelerating Spending, Worsening Outcomes (Commonwealth Fund, Jan. 2023). https://doi.org/10.26099/8ejy-yc74 https://doi.org/10.26099/8ejy-yc74