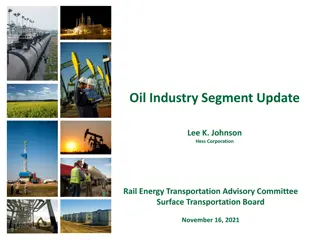
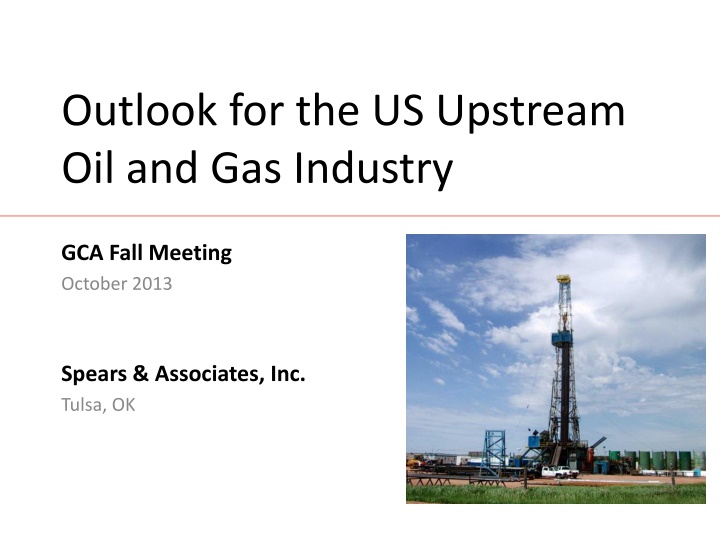
US Upstream Oil and Gas Industry Outlook
This report provides insights into the outlook of the US upstream oil and gas industry, covering aspects such as oilfield equipment and service sector expenditures, global oil consumption trends, OPEC and non-OPEC supply projections, and expected oil price movements.

Download Presentation

Please find below an Image/Link to download the presentation.
The content on the website is provided AS IS for your information and personal use only. It may not be sold, licensed, or shared on other websites without obtaining consent from the author.If you encounter any issues during the download, it is possible that the publisher has removed the file from their server.
You are allowed to download the files provided on this website for personal or commercial use, subject to the condition that they are used lawfully. All files are the property of their respective owners.
The content on the website is provided AS IS for your information and personal use only. It may not be sold, licensed, or shared on other websites without obtaining consent from the author.
E N D
Presentation Transcript
Outlook for the US Upstream Oil and Gas Industry Land oil drilling rig in North Dakota GCA Fall Meeting October 2013 Spears & Associates, Inc. Tulsa, OK
Oilfield Equipment and Service Sector Global expenditures on oilfield equipment and services have grown at a 11% CAGR since 2005. The US accounts for ~45% of the global market. Global Oilfield Equipment and Service Spending $450 $400 $350 $300 Billions $250 $200 $150 $100 $50 $- 2005 2006 2007 2008 2009 2010 2011 2012 2013 2014 2 Spears and Associates
Macro-Environment: Oil Global oil use is expected to increase by 1.1 million bpd in 2013 (up 1.2%) to an average of 90.0 million bpd; consumption is expected to grow 1.4% in 2014 (up 1.2 million bpd to an average of 91.2 million bpd). Oil markets continue to hyperventilate about the rate of growth of Chinese oil demand (the source of ~45% of global demand growth since 2009), given worries about the future pace of overall economic growth in China. While the rate of gain in Chinese import growth has apparently declined relative to last year, it is unknown to what extent this is due to a slowdown in the rate of demand growth as opposed to a slowdown in the growth of inventories. 3 Spears and Associates
Macro-Environment: Oil Supply from non OPEC countries is now projected to increase 1.26 million bpd in 2013 (to an average of 54.0 million bpd) and 1.7 million bpd in 2014. US oil production is expected to account for 74% and 37% of the non-OPEC growth in 2013 and 2014, respectively. OPEC crude oil output is expected to fall 800,000 bpd (down 2.8%) in 2013 and then decline another 240,000 bpd (0.8%) in 2014. While Iraqi oil production continues to build, we believe that the EIA is to optimistic about the collective production capacity additions from the African members of OPEC (Libya, Nigeria, Algeria, and Angola) in 2014. We project that OPEC s surplus production capacity will average 2.9 million bpd in 2013 (up 35% from 2012) and 3.4 million bpd in 2014 (up 17%). 4 Spears and Associates
Macro-Environment: Oil Falling OPEC production capacity utilization through the end of 2014 is expected to put downward pressure on oil prices over the coming year (barring increased geopolitical concerns). Brent spot prices are projected to average $105/bbl in 2013 (down 6%) and $100/bbl in 2014 (down 5%), due to increased crude production from non-OPEC countries. We estimate that spot WTI prices will average $97/bbl in 2013, up 3% for the year, and $90/bbl in 2014, down 7%. Increased pipeline capacity from the Mid Continent to the Gulf Coast beginning in late 2013 will put pressure on the WTI market over the coming year, but the lower cost of pipeline transportation (relative to rail-by-crude) may make it a wash in terms of an operator s bottom line. 5 Spears and Associates
Macro-Environment: Gas The EIA projects that US gas consumption will average 69.9 bcfd in 2013 (up 0.4%) and 69.3 bcfd in 2014 (down 0.9%). Gas used for power generation is projected to decline in 2013 and 2014; however, this is offset in part by increased gas use in the industrial sector. US gas imports are now projected to drop 3.5% in 2013 (to 8.28 bcfd) and another 0.2% in 2014 (to 8.26 bcfd). US Gas Demand by Sector(bcfd) Year 2008 2009 2010 2011 2012 2013 2014 Residential Commercial 13.3 13.0 13.5 13.0 11.4 13.2 12.8 Industrial Power 18.2 18.9 20.2 20.8 25.0 22.2 21.7 8.6 8.5 8.7 8.7 7.9 8.7 8.7 18.2 16.7 18.1 18.4 19.5 20.0 20.3 6 Spears and Associates
Macro-Environment: Gas Game-changer: US gas exports Under a best case scenario US gas exports are forecast to accelerate sharply beginning in 2015 due to increased demand from Mexico and the start of LNG exports from new plants along the Gulf of Mexico. US gas exports are forecast to grow at a rate of 600-1,100 bcf per year (1.6- 3.0 bcfd) over the 2015 to 2019 timeframe. US gas production is projected to grow at an average of about 200 bcf per year (0.5 bcfd) over the 2012 to 2015 timeframe. However, in order to handle both projected export growth and increased domestic demand, in this scenario US gas production is projected to increase at a rate of 900-1,200 bcf per year (2.5-3.3 bcfd) over the 2015 to 2019 timeframe. Gas exports will account for ~80% of the growth in US gas production over the 2015-2019 timeframe. 7 Spears and Associates
Macro-Environment: Gas Based on year-to-date results and current supply and demand trends, we project that US spot gas prices will average $3.62/mmbtu in 2013, up 34% for the year. The forecast calls for US spot gas prices to average $3.85/mmbtu in 2014, up 6%, as supply growth remains subdued and demand growth moves in line with gradually improved economic activity. 8 Spears and Associates
US: Oilfield Inflation US land rig rates in Q2 2013 averaged about $25,300 per day, down 2% from the previous quarter and 2% lower than the year-ago level. Over the past year US land rig rates have fallen as the market has softened due to lower utilization. We expect that the US land rig market will see further price deterioration. We project that US land rig rates will average $25,000 in 2013, (down 2%), and $24,000 in 2014 (down 4%). The decline in spot prices for OCTG has slowed in recent months as increased footage drilled is translating into higher pipe consumption. 9 Spears and Associates
US: Oilfield Inflation The overall unit cost of goods and services used to drill new wells continues to trend lower. The Spears Drilling and Completion Services Cost Index survey found that unit costs in the US fell 0.3% in Q2 2013, leaving overall costs 3.5% lower than the year-ago level. [This analysis does not include the impact on well costs of efficiency gains or product substitutions.] Given the outlook for US drilling activity and gains in rig efficiency, demand is expected to remain below existing capacity in many sectors over the coming year. 10 Spears and Associates
US: Rig Efficiency and Regulations Across all unconventional resource plays, most operators have moved away from held by production (HBP) drilling activity to resource development programs characterized by multi- well pad drilling. This factory drilling approach, combined with their HBP experience, has allowed them to optimize their well designs and drilling and completion practices. The result has been a sharp jump in rig efficiency measured in terms of wells drilled per rig per year over the past two year for both horizontally-drilled and directionally-drilled wells. 11 Spears and Associates
US: Rig Efficiency and Regulations Overall rig efficiency is up about 9% in 2013; a similar increase is expected next year. In addition to the improvement in rig efficiency, well depth has also been increasing at a rate of 2%-3% per year primarily due to longer lateral sections in horizontal wells. The EPA s reduced emission completion (REC) requirements (to be fully phased-in 1/1/2015) already impacting production operations as operators retrofit existing storage facilities; many operators yet to address REC impact on flowback equipment/operations. EPA studies to be released in 2014 may lead to state/federal regulations impacting frac fluid transport and disposal operations. 3/15/2025 12
US Drilling We believe that in 2014 US operators will continue to turn from outspending cash flow (to acquire acreage, drill exploratory wells, and experiment with ways to optimize production) to a resource model that emphasizes living within cash flow. In this model, new technology and efficiency improvements become an integral component of operator efforts to prosper in a flat commodity price environment. The current slowdown in overall US rig activity continues to mitigate on a rate-of-change basis but in absolute terms US rig count will likely be little changed over the balance of this year and next. Our projections indicate that as of year-end 2013 overall US rig count will be unchanged from that of year-end 2012, and that year- end 2014 rig count will be 2% lower than year-end 2013. 13 Spears and Associates
US Drilling US Regional Drilling Activity Overall US rig count is forecast to fall 8% in 2013 to an average of 1,769 active rigs. US rig count in 2014 is forecast to average 1,765 active rigs (unchanged). Average Active Rigs Change 2011 2012 2013 2014 2012 2013 2014 Region A A E E A E E -57% -34% -35% -16% 73% -35% 30% -23% -20% -9% 92% 32% 17% 16% -8% 34% -31% 0% 2% -37% 4% -1% 8% 10% 2% -30% -28% -35% -15% 45% -1% -3% -19% -25% -14% 12% -6% -11% -6% -5% -19% -17% 0% 4% 7% -9% 0% -12% 34% -8% -4% -4% -5% 0% -2% -2% -4% -2% -2% -1% -6% 1% -2% 3% -1% 5% 6% 3% 4% 1% 4% 4% -4% 0% 0% Haynesville Barnett Fayetteville Marcellus Utica Appalachia Eagle Ford Ardmore Woodford Cana Woodford Granite Wash Mississippian Other Louisiana Williston Permian Other Texas Uintah Piceance Other Wyoming DJ/Niobrara Farmington Other Mid Continent Southeast West Coast Other Rockies Total 136 70 31 126 13 20 180 28 53 91 37 70 175 424 123 27 33 45 41 10 61 19 52 59 46 20 106 23 13 235 22 43 82 71 92 204 491 114 36 23 44 42 41 33 13 90 34 13 228 17 32 71 79 86 181 462 107 29 19 44 44 39 31 12 90 33 13 219 17 31 70 74 87 178 475 107 31 20 46 46 In 2013 regional rig count varies from a 45% increase in the Utica shale rig count to a 35% decrease in Fayetteville shale activity. In 2014 it appears that those areas where most rigs are drilling horizontal wells will tend to see a decline in rig activity as increased rig productivity leads to a reduction in the number of rig days worked. Horizontal rigs will account for 62% of the US rig count in 2013, followed by directional rigs (13%) and vertical rigs (25%). Horizontal rig count is expected to fall 2% in 2014 while directional rig count is expected to increase 13%. 6 7 7 64 19 56 9 58 19 49 12 60 20 47 12 8 1,874 1,919 1,769 1,765 14 Spears and Associates
US Drilling In 2013 US well count is projected to reach 48,500 wells (up 1%). US operators are forecast to drill about 49,700 wells (up 2%) in 2014. New Gas Wells Drilled (000) 18.0 16.0 14.0 We estimate that 31,700 new oil wells will be drilled in 2013, up 1% for the year and that the number of new gas wells drilled will grow 3% to 9,800 wells. 12.0 10.0 8.0 6.0 4.0 For 2014 we estimate that 32,400 new oil wells will be drilled, up 2%, and that the number of new gas wells drilled will increase 6% to 10,400 wells. 2.0 0.0 2010 2011 2012 2013 2014 2015 2016 2017 2018 2019 The number of new horizontal wells drilled is expected to reach 15,900 wells in 2013, up 4%, and hold steady in 2014. 15 Spears and Associates
US Drilling: Permian Basin Permian Drilling Outlook Stimulation materials are in good supply and frac dates are readily available. The inventory of equipment is adequate for all services. Category 2011 2012 2013 2014 2015 2012 2013 2014 2015 Active Rigs Horizontal Directional Vertical Total 83 16 338 437 138 21 341 500 174 18 277 470 190 20 273 484 200 20 277 498 66% 34% -15% 1% -19% 15% 27% 9% 12% -2% 3% 5% 0% 1% 3% Finding and keeping qualified personnel to operate the rigs and equipment continues to be an issue. -6% Wells Drilled Horizontal Directional Vertical Total 996 192 1,818 283 2,533 264 2,980 321 3,262 334 83% 48% 11% 17% 39% -7% 2% 7% 18% 21% -2% 2% 9% 4% 1% 3% Operator s focus is moving to horizontal Wolfcamp and Cline wells rather than vertical Wolfberry wells. Horizontal drilling in the deeper Delaware Basin also continues to increase. 10,801 11,939 12,208 12,025 12,205 11,989 14,040 15,005 15,326 15,801 Well Depth Days to Drill Year Average Length of Lateral Section 2010 2011 2012 5,000 10 9 10 2010 3,300 10,000 19 20 19 2011 3,500 15,000 30 30 25 2012 3,700 3/15/2025 16
US Drilling: Eagle Ford Eagle Ford Drilling Outlook Eagle Ford drilling has plateaued although the outlook is positive for the play with many more years of development. Most operators have explored their original acreage positions and have tightened up into their core areas. Development drilling is yielding IPs of 4,800-6,300 BOEPD. Category 2011 2012 2013 2014 2015 2012 2013 2014 2015 Active Rigs Horizontal Directional Vertical Total 173 228 207 18 190 26 182 30 32% 159% 388% -33% 29% -9% -8% 44% -1% -4% -4% 15% 1% -2% 1 4 8 12 186 7 7 7 -7% -3% 239 232 223 220 Wells Horizontal Directional Vertical Total 2,072 3,006 3,006 261 253 3,520 2,980 408 249 3,636 2,975 489 253 3,717 45% 185% 437% -33% 33% 0% -1% 56% -1% 3% 0% 20% 1% 2% 17 407 2,495 49 273 3,327 The services market is saturated. Well programs have been optimized and AFE costs have dropped. Improved drilling efficiency has led to the delivery of more wells with less equipment in less time. -7% 6% Well Depth Days to Drill 3/15/2025 17
Canada Drilling Canadian rig count continues to improve on a rate- of-change basis. Rig count in Q4 2013 is now projected to run about 16% ahead of the year-ago level. As a result, in 2013 Canadian drilling activity is forecast to average of 367 active rigs (up 1%), 11,000 new wells drilled (up 1%), and 71 million feet of hole (up 2%). For 2014 Canadian drilling activity is forecast to average of 378 active rigs (up 3%), 11,300 new wells drilled (up 3%), and 71 million feet of hole (up 4%). 18 Spears and Associates
International Drilling Overall International drilling is forecast to rise 6% in 2013 to an average of 1,296 active rigs, accounting for about 13,900 wells and 104 million feet of hole drilled. Onshore rig count is projected to rise 6% in 2013; offshore drilling is forecast to increase 9%. Overall International drilling activity is projected to rise 5% in 2014 to an average of 1,360 rigs. On a regional basis, International activity in 2014 is expected to exhibit the following changes: Mid East (+8%), Europe (+7%), Central and South America (+5%), Far East (+3%), and Africa (+2%). Region Central and South America Europe Africa Mid East Far East Total* 2014 451 114 181 354 260 1,360 2013 429 107 178 329 253 1,296 Change +22 +7 +3 +25 +7 +64 19 Spears and Associates
Summary Oil prices are expected to decline 7% in 2014 as new supply additions exceed global demand growth. US gas prices are expected to rise 6% in 2014 as production growth stagnates while demand gradually improves. The cost to drill and complete new wells in the US is expected to continue falling at 3%-4% per year through 2014. Changes in US rig count and well count have uncoupled over the past two years as the efficiency with which horizontal and directional wells are drilled has improved almost 20%. The number of new wells drilled in the US is projected to rise 2% in 2014, helped by a 6% increase in gas well drilling. Further growth is also expected in Canadian and International activity in 2014. Private equity firms are expected to remain active in the US oilfield equipment and service market in 2014 (capital requirement is lower than oilco investment and investment timeframe is shorter) Concerns: 1. Too much upstream spending leading to overproduction and lower prices 2. Surplus production capacity but the technology that has to be deployed demands the higher return afforded by $80+ oil 20 Spears and Associates
Spears and Associates Spears & Associates is a Tulsa, OK based firm whichhas provided market research and business information services to the worldwide petroleum equipment and service industry since 1965, specializing in products and services used in exploration, drilling & completion, production, transportation and refining. Current and former clients include petroleum equipment manufacturers, oilfield service firms, producers, financial institutions, trade associations, and government entities. Spears also provides independent commercial due diligence and advisory services in support of oilfield mergers/acquisitions and IPOs. In addition to our market research and consulting assignments, Spears and Associates produces several publications covering the upstream petroleum industry, including: the quarterly Drilling and Production Outlook, the annual Oilfield Market Report, the quarterly Drilling and Completion Services Cost Index, the weekly Oilfield Market Intelligence report on commercial developments in the NAM upstream industry, and the Oilfield Logix series of regional market reports. 21 Spears and Associates