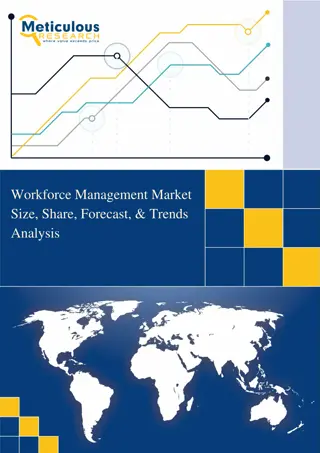
USGS Workforce Data Overview

This presentation highlights workforce planning using data from the Office of Human Capital at the U.S. Geological Survey. It covers accessing workforce data, resources, tools, and navigating through the USGS Workforce Demographics Dashboard.

Download Presentation

Please find below an Image/Link to download the presentation.
The content on the website is provided AS IS for your information and personal use only. It may not be sold, licensed, or shared on other websites without obtaining consent from the author.If you encounter any issues during the download, it is possible that the publisher has removed the file from their server.
You are allowed to download the files provided on this website for personal or commercial use, subject to the condition that they are used lawfully. All files are the property of their respective owners.
The content on the website is provided AS IS for your information and personal use only. It may not be sold, licensed, or shared on other websites without obtaining consent from the author.
E N D
Presentation Transcript
1 Workforce Planning: Using the Data Presented by: Office of Human Capital, Strategic Initiatives Group Thursday, May 23rd, 2019 U.S. Department of the Interior U.S. Geological Survey
2 Agenda 1) Introduction 2) Session Purpose 3) Topic 4) Community Dialogue 5) Check Out
3 USGS Workforce Data Standards
4 RESOURCES Workforce Planning Toolkit https://www.usgs.gov/about/organization/science-support/human-capital/usgs-workforce-planning-toolkit
5 Getting your Workforce Data 1. Work with Kathy Takacs (ktakacs@usgs.gov) to obtain FPPS and Datamart access 2. Take a very brief training session on how to use OBIEE 3. Access your data through the USGS Workforce Demographics Dashboard
6 Where and how can you get your workforce data? Start here: https://dmartportal.ibc.doi.gov/DMARTPORTAL/
7 Getting into OBIEE Click on the OBIEE Login link
8 Getting into OBIEE Type in your FPPS/Datamart User Name and Password Then click on Sign in
9 Getting into OBIEE Read the Warning, then Click on Continue to OBIEE
10 Getting into the USGS Dashboard Click on Dashboards to get the drop down menu
11 Getting into the USGS Dashboard Open up the DOI-USG Agency Dashboards drop down
12 Getting into the USGS Dashboard Click on USGS Workforce Demographics
13 The USGS Workforce Demographics Dashboard: General Workforce Demographics Tab
14 The USGS Workforce Demographics Dashboard: FPPS Retirement Eligibility & Projections Tab
15 The USGS Workforce Demographics Dashboard: Hires and Separations Tab
16 The USGS Workforce Demographics Dashboard: Retirement Data Tab
17 The USGS Workforce Demographics Dashboard: Research and Development Tab
18 Putting in data limits
19 Getting pre-built results
20 Putting in data limits
21 Getting pre-built results
22 Using Pre-built Dashboard data tables Choose the table you want from the drop-down list, and the analysis will create the table for you. 1 2 You can also choose to Export the data table results.
23 What can the data tell you? EXAMPLE: WORKFORCE FLEXIBILITY Workforce flexibility is an indicator of the workforce s ability to expand or contract. Some organizations mandate Other Than Permanent percentages of the workforce, others do not. The appropriate percentage of the workforce that is flexible (other than permanent) may be impacted by the need for stability, the need to react to budget fluctuations (such as an organization dependent on reimbursable income), or the need to acquire specialized skills quickly or on a short term basis.
24 Workforce Flexibility Percent of Permanent Non-Student: All Employees: 78.9% Administrative: 92.2% Science Professionals: 90.1% Science Support Techs: 86.2% Clerical: 81.3% Science Technicians: 65.8% Student Interns (OWC): 0.0%
25 EXAMPLE: Retirement Eligibility - POSSIBLE losses due to retirements If we look at Retirement Eligibility, less than 17% of this workforce will be eligible to retire by the end of FY 2019 (as of pay period 2019 06). Science Professionals: 27.9% by EOFY 2019; 31.7% by EOFY 2020. Administrative staff: 24.7% by EOFY 2019; 33.7% by EOFY 2020. Clerical staff: 30.8% by EOFY 2019; 46.2% by EOFY 2020.
26 EXAMPLE: Retirement Projections - PROBABLE losses due to retirements If we look at Retirement Eligibility, less than 17% of this workforce will be eligible to retire by the end of FY 2019 (as of pay period 2019 06). Science Professionals: 27.9% by EOFY 2019; 31.7% by EOFY 2020. Administrative staff: 24.7% by EOFY 2019; 33.7% by EOFY 2020. Clerical staff: 30.8% by EOFY 2019; 46.2% by EOFY 2020.
27 You can download your raw data for additional analysis
28 You will get a download of data.
29 Scroll down to the bottom, and choose Export
30 Choose Excel -
31 Then choose Excel 2003 -
32 Click on the downloaded file at lower left
33 You will get an ominous-sounding message - Just tell it Yes , you want to open the file anyway -
34 Excel will launch - - and load your data into an Excel worksheet.
35 The worksheet loads in Protected View - Just click on Enable Editing
36 Excel will then open a regular version of the file
37 When saving the file - 1 Change the file type from *.mht, *.mhtl to Excel Workbook (*.xlsx) and click on Save 3 2
38 RESOURCES For help with forms or access to FPPS, the FPPS Datamart, or the OBIEE data mining tool, contact Kathy Takacs at ktakacs@usgs.gov
39 RESOURCES For assistance or problems with OBIEE and the Datamart, please contact the DOI / IBC Customer Support Center (CSC) at 1-888-367-1622 or via e-mail at FPPS_Helpdesk@ios.doi.gov.
40 RESOURCES For questions about the USGS Workforce Demographics Dashboard, contact: Pam Agnew, Workforce Data Program Manager, pagnew@usgs.gov, 703-648- 7435 Brian Arnold-Renicker, Program Analyst, brenicke@usgs.gov, 303-236-9578