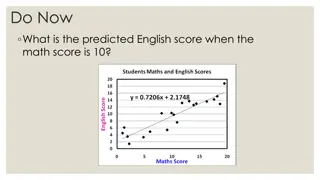
Using Categorical Data in Regression and Interpreting Coefficients
In regression analysis, categorical data can be converted into dummy variables to analyze how they impact the outcome variable. By creating binary variables based on categories like street names, we can interpret coefficients to understand the effect on prices. This process involves constructing dummy variables, running regressions, and interpreting coefficients to gain insights into the relationship between categorical variables and the dependent variable.

Download Presentation

Please find below an Image/Link to download the presentation.
The content on the website is provided AS IS for your information and personal use only. It may not be sold, licensed, or shared on other websites without obtaining consent from the author.If you encounter any issues during the download, it is possible that the publisher has removed the file from their server.
You are allowed to download the files provided on this website for personal or commercial use, subject to the condition that they are used lawfully. All files are the property of their respective owners.
The content on the website is provided AS IS for your information and personal use only. It may not be sold, licensed, or shared on other websites without obtaining consent from the author.
E N D
Presentation Transcript
QM222 Class 8 Section A1 QM222 Class 8 Section A1 Using categorical data in regression Using categorical data in regression And if time, beginning on coefficient statistics QM222 Fall 2017 Section A1 1
To To- -dos dos Assignment 2 is due on Wednesday But you lose only a tiny fraction of points for each day late so it s better to hand in a completed assignment. QM222 Fall 2017 Section A1 2
Today: Today: We learn how to make a categorical variable (with 2 categories) into a dummy variable, a variable that is one if in one category, zero otherwise We learn to make new variables in Stata We learn how to make a dummy variable in Stata, using logical statements We run a regression using this dummy variable, and interpret the coefficient on this variable. We start learning about statistics about coefficients. QM222 Fall 2017 Section A1 3
Dummy variables Dummy variables (also called indicator variables, binary variables) (also called indicator variables, binary variables) Dummy variables take a value of one if a condition is true (that is, a given observation falls into a category) and zero otherwise. In the Brookline condo data, we know the StreetName Let s say that we believe that whether a condo is on Beacon Street (or not) will change its price. Using data on streets, we can construct a dummy variable, making beaconstreet=1 if a condo is located on Beacon Street, and beaconstreet=0 if located elsewhere. Note: In this example there are TWO categories: On Beacon or not. We make ONE dummy variable. QM222 Fall 2017 Section A1 4
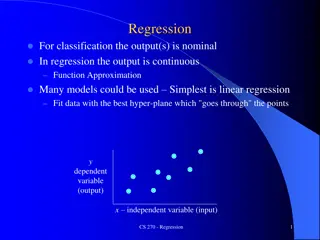
Interpreting a Regression with an Dummy Variable Interpreting a Regression with an Dummy Variable We write down the following linear regression model: ????? = ?0+ ?1???????????? To understand the interpretation of the coefficients, let s start with the calculation of the following predictions: Price of condos on Beacon Street (beaconstreet=1): ????? = ?0+ ?1 * beaconstreet = ?0 + ?1*1 = ?0 + ?1 Price of condos located elsewhere (beaconstreet =0): ????? = ?0+ ?1 * beaconstreet = ?0 + ?1*0 = ?0 In other words, the regression with the dummy beaconstreet will give us the value of prices n bBeacon Street (when beaconstreet=1) and not on Beacon Street (when BeaconsStreet=0). We call NOT being on Beacon St. the reference category. It is what happens when the dummy is NOTTRUE, is not equal to 1. QM222 Fall 2017 Section A1 5
Today: Today: We learn how to make a categorical variable (with 2 categories) into a dummy variable, a variable that is one if in one category, zero otherwise We learn to make new variables in Stata We learn how to make a dummy variable in Stata, using logical statements We run a regression using this dummy variable, and interpret the coefficient on this variable. We start learning about statistics about coefficients. QM222 Fall 2017 Section A1 6
Open Brookline Condo data set in Stata Open Brookline Condo data set in Stata (Other materials/ (Other materials/brookline_condo.dta brookline_condo.dta) ) Sale Price Base floor Building Style 4 MID-RISE 1 DECKER 1 ROW-END 2 LOW-RISE 4 MID-RISE 1 DECKER 7 HIGH-RISE 3 LOW-RISE 1 CONVERTED-HOUSE 0 6 HIGH-RISE 6 HIGH-RISE 1 CONVERTED-HOUSE 0 2 LOW-RISE 1 DECKER 6 HIGH-RISE 6 MID-RISE Full bathrooms Half Bathrooms Garage parking Street Number Street Name 150 PLEASANT ST 7 LEVERETT ST 24 EUSTON ST 417 WASHINGTON ST 150 PLEASANT ST 135 MASON TER 20 CHAPEL ST 32 JUNIPER ST 41 ACKERS AVE 1731 BEACON ST 70 PARK ST 103 SEWALL AVE 27 ENGLEWOOD AVE 33 STANTON RD 1600 BEACON ST 55 SEWALL AVE Size Elevators Rooms 1 0 0 0 1 0 6 0 Bedrooms 174000 337000 850000 516000 145000 962000 676000 265000 357500 382000 391000 564000 310000 573000 548000 380000 1060 831 2246 1574 669 986 1561 822 986 947 1201 1083 792 1300 950 908 4 4 2 2 6 3 1 3 2 2 2 1 2 2 2 3 2 2 1 1 3 2 1 2 2 1 1 1 2 2 1 2 2 1 1 0 0 0 0 1 0 0 0 0 0 0 0 0 0 1 1 0 0 0 1 0 2 0 0 1 1 0 0 0 1 1 10 6 3 7 6 5 5 4 4 4 5 7 4 4 2 4 0 0 2 1 QM222 Fall 2017 Section A1 7
Making new variables in Stata Making new variables in Stata Stata commands can only be lower case. Stata variable names are sensitive to case (lower case/upper case). It is easiest if you keep names in lower case and keep out spaces. Try to keep the names relatively short (so they all print out in lists) How do you make new numerical variables in Stata? In Stata: generate newvar = (here put in a formula using PEMDAS, numbers, and variable names) QM222 Fall 2017 Section A1 8
Making new variables in Stata Making new variables in Stata For instance, you might want to create a variable for the average size per room. DO IT! gen roomsize=size/Rooms Stata tip: you can generally abbreviate Stata commands. Here, I always use gen instead of generate But how do we generate the variable beaconstreet that is equal to one IF something is true? You need a logical statement! Stata (like Excel) uses logical statements starting with the word if added to a command QM222 Fall 2017 Section A1 9
Logical (if) Logical (if) statements statements In Stata logical statements (only), you can use these operators : == ( double equal signs) equals (use in logical statements only) & and | or != not equal to < > <= >= obvious Example: sum wage if agep>=25 QM222 Fall 2017 Section A1 10
Making an dummy variable for Beacon Street Making an dummy variable for Beacon Street First browse the data to see how StreetName is coded. DO IT! gen beaconstreet = 1 if StreetName == BEACON ST Browse again. Why are there so many missing values? Because we didn t tell the computer what to do if StreetName is NOT BEACON ST What to do instead? replace beaconstreet = 0 if StreetName != BEACON ST Or, first start by: gen beaconstreet=0 then replace beaconstreet=1 if StreetName == BEACON ST DO IT! QM222 Fall 2017 Section A1 11
Making an dummy variable for Beacon Street Making an dummy variable for Beacon Street Optional You can also make a dummy variable in one step, since Stata (like many programs) will put in a 1 if a logical statement is true and a 0 if it is false. Here you could type: generatebeaconstreet = streetname == BEACON ST QM222 Fall 2017 Section A1 12
Today: Today: We learn how to make a categorical variable (with 2 categories) into a dummy variable, a variable that is one if in one category, zero otherwise We learn to make new variables in Stata We learn how to make a dummy variable in Stata, using logical statements We run a regression using this dummy variable, and interpret the coefficient on this variable. We start learning about statistics about coefficients. QM222 Fall 2017 Section A1 13
Now run a regression of price on Now run a regression of price on beaconstreet beaconstreet regress price beaconstreet DO IT! QM222 Fall 2017 Section A1 14
(I changed the font here to Courier New) (I changed the font here to Courier New) . regress price beaconstreet Source | SS df MS Number of obs = 1,085 -------------+---------------------------------- F(1, 1083) = 3.31 Model | 2.2855e+11 1 2.2855e+11 Prob > F = 0.0689 Residual | 7.4673e+13 1,083 6.8951e+10 R-squared = 0.0031 -------------+---------------------------------- Adj R-squared = 0.0021 Total | 7.4902e+13 1,084 6.9098e+10 Root MSE = 2.6e+05 ------------------------------------------------------------------------------ price | Coef. Std. Err. t P>|t| [95% Conf. Interval] -------------+---------------------------------------------------------------- beaconstreet | -46969.18 25798.41 -1.82 0.069 -97589.71 3651.345 _cons | 520728.9 8435.427 61.73 0.000 504177.2 537280.5 ------------------------------------------------------------------------------ Write the regression equation: What is the predicted price of a condo on Beacon Street? What is the predicted price of a condo that s not on Beacon Street? What is the difference in prices between those on Beacon St. and NOT? QM222 Fall 2017 Section A1 15
(I changed the font here to Courier New) (I changed the font here to Courier New) . regress price beaconstreet Source | SS df MS Number of obs = 1,085 -------------+---------------------------------- F(1, 1083) = 3.31 Model | 2.2855e+11 1 2.2855e+11 Prob > F = 0.0689 Residual | 7.4673e+13 1,083 6.8951e+10 R-squared = 0.0031 -------------+---------------------------------- Adj R-squared = 0.0021 Total | 7.4902e+13 1,084 6.9098e+10 Root MSE = 2.6e+05 ------------------------------------------------------------------------------ price | Coef. Std. Err. t P>|t| [95% Conf. Interval] -------------+---------------------------------------------------------------- beaconstreet | -46969.18 25798.41 -1.82 0.069 -97589.71 3651.345 _cons | 520728.9 8435.427 61.73 0.000 504177.2 537280.5 ------------------------------------------------------------------------------ Write the regression equation: price = 520729 46969 Beacon_Street What is the predicted price of a condo on Beacon Street? 520729 46969=$473,760 What is the predicted price of a condo that s not on Beacon Street? $520,729 What is the difference in prices between those on Beacon St. and NOT? $46,969 YOU PICK UP THE COEFFICIENT ON THE DUMMY ONLY IF THE DUMMY=1 QM222 Fall 2017 Section A1 16
Challenge questions (for team) Challenge questions (for team) . regress price beaconstreet Source | SS df MS Number of obs = 1,085 -------------+---------------------------------- F(1, 1083) = 3.31 Model | 2.2855e+11 1 2.2855e+11 Prob > F = 0.0689 Residual | 7.4673e+13 1,083 6.8951e+10 R-squared = 0.0031 -------------+---------------------------------- Adj R-squared = 0.0021 Total | 7.4902e+13 1,084 6.9098e+10 Root MSE = 2.6e+05 ------------------------------------------------------------------------------ price | Coef. Std. Err. t P>|t| [95% Conf. Interval] -------------+---------------------------------------------------------------- beaconstreet | -46969.18 25798.41 -1.82 0.069 -97589.71 3651.345 _cons | 520728.9 8435.427 61.73 0.000 504177.2 537280.5 ------------------------------------------------------------------------------ What regression would you get if you made a dummy variable =1 if the condo is NOT on Beacon Street (notonbeacon)? 1. The intercept (constant _cons) would be: 2. The coefficient would be: A. 46969 B. -46969 C. 520729 D. 473760 QM222 Fall 2017 Section A1 17
Today: Today: We learn how to make a categorical variable (with 2 categories) into a dummy variable, a variable that is one if in one category, zero otherwise We learn to make new variables in Stata We learn how to make a dummy variable in Stata, using logical statements We run a regression using this dummy variable, and interpret the coefficient on this variable. We start learning about statistics about coefficients. QM222 Fall 2017 Section A1 18
How certain are we that the coefficients How certain are we that the coefficients we measured are accurate we measured are accurate in light of the fact in light of the fact that we have limited that we have limited numbers of numbers of observations? observations? QM222 Fall 2017 Section A1 19
Lets remember means and standard deviations Let s remember means and standard deviations with normally distributed with normally distributed variables Approximately 68% (or around 2/3rds) of a variable s values are within one standard deviation of the mean. We call this this the 68% confidence interval (CI), because 68% of the time, the value falls in this range. Approximately 95% of the values are within two standard deviations of the mean. We call this this the 95% confidence interval, 2.0 is just 1.96 rounded. Use either! variables File:Standard deviation diagram.svg QM222 Fall 2017 Section A1 20
Central Limit Theorem (QM221) Central Limit Theorem (QM221) The Central Limit Theorem tells us that if you took many samples from a population, the sample means are always distributed according to a normal distribution curve The average of the sample means (across many samples) is the same as the population mean ( ) The standard deviation of the sample means (across many samples) is the standard error (se) File:Standard deviation diagram.svg -3SE -2SE -1SE +1SE +2SE +3SE QM222 Fall 2017 Section A1 21
Standard errors more generally Standard errors more generally Sample means have a standard error that tells you how much the means vary if you had lots of different samples. Any statistic estimated on a sample has a standard error that tells you how much that statistic would vary if you had lots of different samples. Regression coefficients also have standard errors. We are (approximately) 68% certain that the true regression coefficient (if estimated on the entire population) will be within one standard error of the estimated coefficient. We are (approximately) 95% certain that the true regression coefficient (if estimated on the entire population) will be within two standard errors of the estimated coefficient. QM222 Fall 2017 Section A1 22
Standard errors of coefficients Standard errors of coefficients price = 12934 + 407.45 size Source | SS df MS -------------+------------------------------ F( 1, 1083) = 3232.35 Model | 5.6104e+13 1 5.6104e+13 Prob > F = 0.0000 Residual | 1.8798e+13 1083 1.7357e+10 R-squared = 0.7490 -------------+------------------------------ Adj R-squared = 0.7488 Total | 7.4902e+13 1084 6.9098e+10 Root MSE = 1.3e+05 Number of obs = 1085 ------------------------------------------------------------------------------ price | Coef. Std. Err. Std. Err. t P>|t| [95% Conf. Interval] -------------+---------------------------------------------------------------- size | 407.4513 7.166659 56.85 0.000 393.3892 421.5134 _cons | 12934.12 9705.712 1.33 0.183 -6110.006 31978.25 Next to each coefficient is a standard error. We are approximately 68% certain that the true coefficient (with an infinitely very large sample) is within one standard error of this coefficient. We are approximately 95% certain that the true coefficient (with an infinitely very large sample) is within two standard errors of this coefficient. 407.45 +/- 7.167 407.45 +/- 2 * 7.167 QM222 Fall 2017 Section A1 23
Standard errors of coefficients Standard errors of coefficients price = 12934 + 407.45 size Source | SS df MS -------------+------------------------------ F( 1, 1083) = 3232.35 Model | 5.6104e+13 1 5.6104e+13 Prob > F = 0.0000 Residual | 1.8798e+13 1083 1.7357e+10 R-squared = 0.7490 -------------+------------------------------ Adj R-squared = 0.7488 Total | 7.4902e+13 1084 6.9098e+10 Root MSE = 1.3e+05 Number of obs = 1085 ------------------------------------------------------------------------------ price | Coef. Std. Err. Std. Err. t P>|t| [95% Conf. Interval] -------------+---------------------------------------------------------------- size | 407.4513 7.166659 56.85 0.000 393.3892 421.5134 _cons | 12934.12 9705.712 1.33 0.183 -6110.006 31978.25 NOTE: The Regression output give you the 95% confidence interval! QM222 Fall 2017 Section A1 24
How is your project coming? How is your project coming? People who work with specific data sets can get together to share the learning about using it. ADD HEALTH users: You need my help to read your data. But first you need to list all of the variables that you could possibly want, and which wave it is in. ACS users: You need a TA to run the do-file (file ending in .do) that you get when you download it for Stata QM222 Fall 2017 Section A1 25


")


")
")
")


")