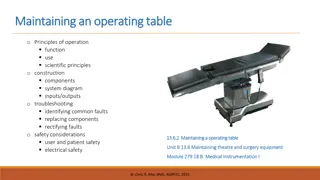
Using Pivot Tables for Improved IR Presence on Campus
In this insightful guide, learn how to harness the power of pivot tables to enhance Institutional Research (IR) presence on campus. Discover practical strategies for creating and utilizing pivot tables effectively, along with alternatives and best practices. Explore the benefits of transparency, accountability, efficiency, and data analysis through pivot tables.

Download Presentation

Please find below an Image/Link to download the presentation.
The content on the website is provided AS IS for your information and personal use only. It may not be sold, licensed, or shared on other websites without obtaining consent from the author.If you encounter any issues during the download, it is possible that the publisher has removed the file from their server.
You are allowed to download the files provided on this website for personal or commercial use, subject to the condition that they are used lawfully. All files are the property of their respective owners.
The content on the website is provided AS IS for your information and personal use only. It may not be sold, licensed, or shared on other websites without obtaining consent from the author.
E N D
Presentation Transcript
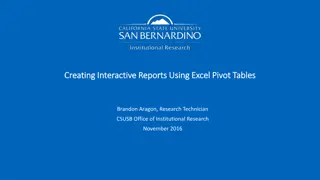
Pivot Tables as Change Agents: How to create and use them to improve IR presence on campus Daniel Martinez, PhD, Director Carlos Carballo, Emila Rahimic, Tessa Rohl Research Analysts November 21, 2014 1
What We Will Cover Today What COD had when I arrived Tables we developed Student Equity Success FTES How to create pivot tables Alternatives to Pivots 2
Why use pivot tables? Transparency/Accountability Drill down Slicers Efficiency Drill down (again!) Grouping Missing data Updates Memory 3
What COD had One researcher DATATEL FTES Tool Issues with Program Review The Challenge: Transparency, Accountability, Efficiency 4
New pivot tables Student Equity Success FTES 5
Pivot pointers Missing data Grouping Slicers Calculated fields: in pivots or in tables Create one pivot then copy Tables Tables updates and slicers Delivery 7
Variable and Pivot Table options Change Grand Total for rows Change Year totals 10
Variable and Pivot Table options Change autofit on update to retain column widths Change Grand Total for rows Change Year totals 11
Add a slicer 13
To drilldown with a slicer, add variable as a filter Add filter here, same as slicer 14
For information about this presentation, please contact Dr. Daniel Martinez Director, Institutional Research damartinez@collegeofthedesert.edu 760-776-7212 15