Valuation Methods and Cash Flows
This content discusses corporate finance topics such as valuation, cash flows, discount rates, and dividend policy. It covers concepts like estimating cash flows, dividend analysis for Deutsche Bank, and FCFE estimation for Tata Motors.

Download Presentation

Please find below an Image/Link to download the presentation.
The content on the website is provided AS IS for your information and personal use only. It may not be sold, licensed, or shared on other websites without obtaining consent from the author.If you encounter any issues during the download, it is possible that the publisher has removed the file from their server.
You are allowed to download the files provided on this website for personal or commercial use, subject to the condition that they are used lawfully. All files are the property of their respective owners.
The content on the website is provided AS IS for your information and personal use only. It may not be sold, licensed, or shared on other websites without obtaining consent from the author.
E N D
Presentation Transcript
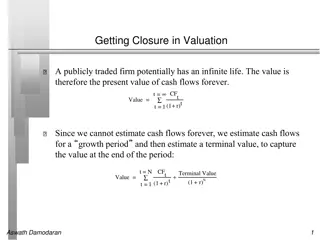
1 VALUATION: CASH FLOWS & DISCOUNT RATES Cash is king.
Set Up and Objective 1: What is corporate finance 2: The Objective: Utopia and Let Down 3: The Objective: Reality and Reaction The Investment Decision Invest in assets that earn a return greater than the minimum acceptable hurdle rate The Financing Decision Find the right kind of debt for your firm and the right mix of debt and equity to fund your operations The Dividend Decision If you cannot find investments that make your minimum acceptable rate, return the cash to owners of your business Hurdle Rate Financing Mix 4. Define & Measure Risk 5. The Risk free Rate 6. Equity Risk Premiums 7. Country Risk Premiums 8. Regression Betas 9. Beta Fundamentals 10. Bottom-up Betas 11. The "Right" Beta 12. Debt: Measure & Cost 13. Financing Weights Dividend Policy 17. The Trade off 18. Cost of Capital Approach 19. Cost of Capital: Follow up 20. Cost of Capital: Wrap up 21. Alternative Approaches 22. Moving to the optimal 24. Trends & Measures 25. The trade off 26. Assessment 27. Action & Follow up 28. The End Game Financing Type 23. The Right Financing Valuation 29. First steps 30. Cash flows 31. Growth 32. Terminal Value 33. To value per share 34. The value of control 35. Relative Valuation Investment Return 14. Earnings and Cash flows 15. Time Weighting Cash flows 16. Loose Ends 2 36. Closing Thoughts
Dividends and Modified Dividends for Deutsche Bank 4 In 2007, Deutsche Bank paid out dividends of 2,146 million Euros on net income of 6,510 million Euros. In early 2008, we valued Deutsche Bank using the dividends it paid in 2007. In my 2008 valuation I am assuming the dividends are not only reasonable but sustainable. In November 2013, Deutsche Bank s dividend policy was in flux. Not only did it report losses but it was on a pathway to increase its regulatory capital ratio. Rather than focus on the dividends (which were small), we estimated the potential dividends (by estimating the free cash flows to equity after investments in regulatory capital) Current 439,851 15.13% 66,561 2014 2015 2016 2017 2018 Steady state 517,556 18.00% 93,160 1,377 103,605 Asset Base Capital ratio Tier 1 Capital Change in regulatory capital Book Equity 453,047 15.71% 71,156 4,595 81,424 466,638 16.28% 75,967 4,811 86,235 480,637 16.85% 81,002 5,035 91,270 495,056 17.43% 86,271 5,269 96,539 509,908 18.00% 91,783 5,512 102,051 76,829 ROE Net Income - Investment in Regulatory Capital FCFE -1.08% -716 0.74% 602 4,595 -3,993 2.55% 2,203 4,811 -2,608 4.37% 3,988 5,035 -1,047 6.18% 5,971 5,269 702 8.00% 8,164 5,512 2,652 8.00% 8,287 1,554 6,733 4
Estimating FCFE (past) : Tata Motors 5 Change in WC Equity Reinvestment Equity Cap Ex Depreciation Change in Debt Reinvestment Rate Year 2008-09 2009-10 2010-11 2011-12 2012-13 Aggregate Net Income -25,053 29,151 92,736 135,165 98,926 330,925 99,708 84,754 81,240 138,756 187,570 592,028 25,072 39,602 46,510 56,209 75,648 243,041 13,441 -26,009 50,484 22,801 680 61,397 25,789 5,605 24,951 30,846 32,970 120,160 62,288 13,538 60,263 74,502 79,632 290,224 -248.63% 46.44% 64.98% 55.12% 80.50% 87.70% 5
Estimating FCFF: Disney 6 In the fiscal year ended September 2013, Disney reported the following: Operating income (adjusted for leases) = $10,032 million Effective tax rate = 31.02% Capital Expenditures (including acquisitions) = $5,239 million Depreciation & Amortization = $2,192 million Change in non-cash working capital = $103 million The free cash flow to the firm can be computed as follows: After-tax Operating Income = 10,032 (1 -.3102) - Net Cap Expenditures Change in Working Capital = = Free Cashflow to Firm (FCFF) = The reinvestment and reinvestment rate are as follows: Reinvestment = $3,629 + $103 = $3,732 million Reinvestment Rate = $3,732/ $6,920 = 53.93% = $6,920 = $5,239 - $2,192 = $3,629 =$103 = $3,188 - 6
II. Discount Rates 7 Critical ingredient in discounted cashflow valuation. Errors in estimating the discount rate or mismatching cashflows and discount rates can lead to serious errors in valuation. At an intuitive level, the discount rate used should be consistent with both the riskiness and the type of cashflow being discounted. The cost of equity is the rate at which we discount cash flows to equity (dividends or free cash flows to equity). The cost of capital is the rate at which we discount free cash flows to the firm. 7
Cost of Equity: Deutsche Bank 2008 versus 2013 8 In early 2008, we estimated a beta of 1.162 for Deutsche Bank, which used in conjunction with the Euro risk-free rate of 4% (in January 2008) and an equity risk premium of 4.50%, yielded a cost of equity of 9.23%. Cost of Equity Jan 2008 = Riskfree RateJan 2008 + Beta* Mature Market Risk Premium = 4.00% + 1.162 (4.5%) = 9.23% In November 2013, the Euro riskfree rate had dropped to 1.75% and the Deutsche s equity risk premium had risen to 6.12%: Cost of equity Nov 13 = Riskfree Rate Nov 13 + Beta (ERP) = 1.75% + 1.1516 (6.12%) = 8.80% 8
Cost of Equity: Tata Motors 9 We will be valuing Tata Motors in rupee terms. That is a choice. Any company can be valued in any currency. Earlier, we estimated a levered beta for equity of 1.1007 for Tata Motor s operating assets . Since we will be discounting FCFE with the income from cash included in the cash, we recomputed a beta for Tata Motors as a company (with cash): Levered BetaCompany= 1.1007 (1428/1630)+ 0 (202/1630) = 0.964 With a nominal rupee risk-free rate of 6.57 percent and an equity risk premium of 7.19% for Tata Motors, we arrive at a cost of equity of 13.50%. Cost of Equity = 6.57% + 0.964 (7.19%) = 13.50% 9
Current Cost of Capital: Disney 10 The beta for Disney s stock in November 2013 was 1.0013. The T. bond rate at that time was 2.75%. Using an estimated equity risk premium of 5.76%, we estimated the cost of equity for Disney to be 8.52%: Cost of Equity = 2.75% + 1.0013(5.76%) = 8.52% Disney s bond rating in May 2009 was A, and based on this rating, the estimated pretax cost of debt for Disney is 3.75%. Using a marginal tax rate of 36.1, the after-tax cost of debt for Disney is 2.40%. After-Tax Cost of Debt = 3.75% (1 0.361) = 2.40% The cost of capital was calculated using these costs and the weights based on market values of equity (121,878) and debt (15,961): Cost of capital = 8.52% (15,961+121,878)+2.40% 121,878 15,961 (15,961+121,878)= 7.81% 10
But costs of equity and capital can and should change over time 11 After-tax Cost of Debt 2.40% 2.40% 2.40% 2.40% 2.40% 2.40% 2.40% 2.40% 2.40% 2.40% Year 1 2 3 4 5 6 7 8 9 10 Beta 1.0013 1.0013 1.0013 1.0013 1.0013 1.0010 1.0008 1.0005 1.0003 1.0000 Cost of Equity 8.52% 8.52% 8.52% 8.52% 8.52% 8.52% 8.51% 8.51% 8.51% 8.51% Debt Ratio 11.50% 11.50% 11.50% 11.50% 11.50% 13.20% 14.90% 16.60% 18.30% 20.00% Cost of capital 7.81% 7.81% 7.81% 7.81% 7.81% 7.71% 7.60% 7.50% 7.39% 7.29% 11
Read Task Chapter 12 Estimate the base year s cash flows & current discount rate for your firm. 12


 : Tata Motors")