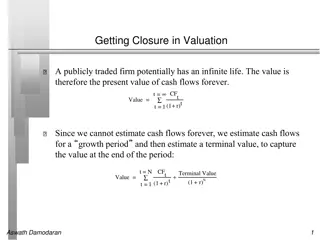
Valuation Statistics and Genuine Sale/Rental Instances Explained
Learn about the importance of statistics in verifying the genuineness of sale/rental instances for valuation professionals in the Valuers Association (India). Explore the meaning of statistics, statistical graphs, and the use of data to ensure authentic valuation reports.

Download Presentation

Please find below an Image/Link to download the presentation.
The content on the website is provided AS IS for your information and personal use only. It may not be sold, licensed, or shared on other websites without obtaining consent from the author. If you encounter any issues during the download, it is possible that the publisher has removed the file from their server.
You are allowed to download the files provided on this website for personal or commercial use, subject to the condition that they are used lawfully. All files are the property of their respective owners.
The content on the website is provided AS IS for your information and personal use only. It may not be sold, licensed, or shared on other websites without obtaining consent from the author.
E N D
Presentation Transcript
USE OF STATISTICS TO DECIDE GENUINENESS OF SALE/RENTAL INSTANCES AVAILABLE WITH VALUERS PRACTICING VALUERS ASSOCIATION (INDIA) COMPILED BY ER. AVINASH D. KULKARNI CHARTERED ENGINEER, GOVT REGD VALUER AND IBBI REGD VALUER SATURDAY 19/06/2021
DEFINITION OF STATISTICS Statistics is the discipline that concerns the collection, organization, Analysis, Interpretation and presentation of data Statistics indicates consistency of data A strong understanding of commonly used statistical methods is useful for valuation professionals creating, defending, or critiquing valuation reports
INTRODUCTION & NECESSITY Importance of Statistics Meaning of Genuineness Meaning of Sale Instance Meaning of Rental Instance Avoid ad hoc assumptions in Valuation Report IVS 202 Investigation & Compliance IVS 104 Basis of Value
STATISTICS IN VALUATION Objectives Convert raw data into useful information Meaning & Use of Statistics Date Number of Observations Sources of Data Primary, Secondary Use of Data Meaningful pattern in Data Raw Data Data Array Frequency Distribution Relative Frequency Distribution
GENUINENESS the quality of truly being what something is said to be; authenticity. the quality of being honest and sincere the quality of being real and exactly what it appears to be undisputed credibility When you are being your true self, you display a genuine sense of honesty and trustworthiness
SALE / RENTAL INSTANCE The act or an instance of selling/Renting ; exchange of property of any kind, or of services, for an agreed sum of money or other valuable consideration Navanath & Ors vs State Of Maharashtra on 15 April, 2009 - IN THE SUPREME COURT OF INDIA both the parties agree that the comparable sales instances method of valuation as adopted by the Reference Court has been rightly adopted.
AVOID AD HOK ASSUMPTIONS IN VALUATION it generally signifies a solution designed for a specific problem or task, non-generalizable, and not intended to be adapted to other purposes Avoid ad hok assumptions in Valuation Report
IVS 102 INVESTIGATION & COMPLIANCE Sufficient evidence shall be assembled by means such as inspection, inquiry, computation and analysis to ensure that the valuation is properly supported First Hand Information duly verified Secondary Sources Technical Journals Valuation Report should stand to judicial inquiry If no input Avoid Valuation Assignment
IVS 104 BASES OF VALUE Compliance with this mandatory standard requires a valuer to select the appropriate basis (or bases) of value and follow all applicable requirements associated with that basis of value whether those requirements are included as part of this chapter (for IVS-defined bases of value) or not (for non IVS-defined bases of value) Such bases have to be interpreted and applied accordingly
IVS 104 BASES OF VALUE Depending on the basis of value, the assumed transaction could take a number of forms: (a) a hypothetical transaction, (b) an actual transaction, (c) a purchase (or entry) transaction, (d) a sale (or exit) transaction, and/or (e) a transaction in a particular or hypothetical market with specified characteristics
IVS 2017 Honesty Valuer should strictly follow valuation procedure ie Data collection, site inspection, analysis, conclusion with reasoning Integrity First integrity to profession and thereafter to client Being Self Conscious Valuer should undertake and complete assignments in accordance with his own conscious and act accordingly
STATISTICS FOR SALE/RENTAL INSTANCE Observation Average of Observation Deviation Square of Deviation Sum of square of deviation Variance Standard Deviation Percentage Deviation Remarks from Valuers
OBSERVATION An observation in statistics is a value of something of interest you're measuring or counting during a study or experiment An observation is a case of the data being collected A variable is an attribute or characteristc of the observation we record in our data All Sale/Rental instances in ascending order datewise
STEPS INVOLVED IN VALUATION Site Visit Collect sale instance data in nearby area Study of transaction value Work out Genuine Sale instance Compare properties involved in Sale Instances with various parameters Finally estimate the Value
PROPERTY MARKET CHARACTERESTICS Heterogeneity & Lack of Standardization No two properties are identical Total land Supply is Fixed Inelastic Supply Effect of various Legislations Imperfect Competition in Market
DATA & COLLECTION Study Area Map from TP Office Index II Sale & Rental Instances Total Permissions in Study Period Short listing of Collected Sale Instances Statement & Graph of Data Collected Collection of Micro Economic data
SOURCES OF DATA Sources of Data Sub Registrar s Office Local enquiry owner, agent etc News Paper Advertisements Land Acquisition Cases Data Auction Sale by Income Tax, Bank etc Valuers Data Bank
SITE INSPECTION Site Visit for Shortlisted properties Specifications & Related information collection Noted down Interviews are carried out Ascertain Transaction Price & Actual price Paid Preferences of Location, Amenities & Facilities Data Collections form Tenants
ADOPTION OF WEIGHTAGES Ad hoc weightages are assigned to various factors of comparison & % additions or deductions are done Secured Property Access Weightage Score System is used to make the comparison as objective as possible P = f (STLA) Size, Time, Location & Age
WEIGHTAGE SCORE Identify Factors of Comparisons & their levels Assign Appropriate weightages & Levels Prepare Weightage Criteria Table Work our Weightages of each of Property Compare the Property on the basis of Total Weightage Score Area factor is More Important
ASPECTS OF COMPARISON FACTORS Physical Situation, Location, Engineering & Building Legal Ownership, Tenure, Easement, TPS Act Social Communication, Civic Amenities, Stigma Economical Employment & Wage Level, Demand & Supply, Credit Facility, Money Market Condition, Rental Yield, Taxation
RENTAL INSTANCES Transaction Date Builtup Area Rent Deposit TWS Virtual Rent Rent/Sqm/Month Calculation
SALE INSTANCES Transaction Date Price paid Builtup Area TWS Estimation of Fair Market rent Annual Rent, Outgoings, Net Rent YP Calculation Rate of Interest Calculation
DEVIATION Deviation that is a difference between an observed value and the true value of a quantity of interest The standard deviation formula may look confusing, but it will make sense after we break it down. ... Step 1: Find the mean. Step 2: For each data point, find the square of its distance to the mean. Step 3: Sum the values from Step 2. Step 4: Divide by the number of data points. Step 5: Take the square root.
VARIANCE In probability theory and statistics, variance is the expectation of the squared deviation of a random variable from its mean it measures how far a set of numbers is spread out from their average value The variance is the square of the standard deviation
STANDARD DEVIATION Standard deviation is a measure of dispersement in statistics Dispersement tells you how much your data is spread out Specifically, it shows you how much your data is spread out around the mean or average The bell curve (what statisticians call a normal distribution ) is commonly seen in statistics as a tool to understand standard deviation
DISPERSION Dispersion refers to a statistical term which depicts the size of the distribution of values expected for a specific variable Dispersion can be estimated by several different statistics, such as range, variance, and standard deviation The measures of dispersion are important as it helps in understanding how much a data is spread (i.e. its variation) around a central value
SALE/RENTAL INSTANCE DATA Sr No Observation Deviation Square % Deviation Remarks Under Weighted 1 2400 -670 448900 -1.67 2 3250 180 32400 0.45 3 3400 330 108900 0.82 Under Weighted 4 2600 -470 220900 -1.17 5 3150 80 6400 0.20 6 3000 -70 4900 -0.17 Over Weighted 7 3700 630 396900 1.57 8 2700 -370 136900 -0.92 Over Weighted 9 3550 480 230400 1.20 10 2950 -120 14400 -0.30 30700 1601000 Average 3070 Variance 160100 Std Deviation 400.12
CORELATION IN STATISTICS Correlation is a statistical measure that expresses the extent to which two variables are linearly related (meaning they change together at a constant rate). 0 - 1 Direct Correlation Rate & Rent 0 to -1 Inverse Correlation YP & ROI
CORELATION IN STATISTICS High degree: If the coefficient value lies between 0.50 and 1, then it is said to be a strong correlation. Moderate degree: If the value lies between 0.30 and 0.49, then it is said to be a medium correlation. Low degree: When the value lies below + . ... No correlation: When the value is zero
WEIGHTED STANDARD DEVIATION To find this type of percent deviation, subtract the known value from the mean, divide the result by the known value and multiply by 100 A weighted standard deviation allows you to apply a weight, or relative significance to each value in a set of values Weighted standard deviations are often used for frequency data
STATISTICS IN DATA MANAGEMENT Location (As per RR Chart) Sale instance, Dast Number & Date Property Type Plot, Bunglow, Flat, Shop etc RR Valuation & Market Value (Price Paid) Market Rate (Rs/Sqm) for Plot, Flat & Shop Mean, Mode & Median
STATISTICS IN DESKTOP VALUATION Rate Research RR Rate Primary - Fair Market Rate as per Index II, Primary Nearby locality Index II (Use STLA) Secondary 99 Acre, Internet inquiry, Advt Mean, Mode, Mediation, Standard Deviation Range of Rates (Before Site Visit) Rate considered after Analysis
STATISTICS IN TWS CALCULATION Description Weightage Sr No Rating Level 1 Level 2 Level 3 Level 4 Level 5 Social Infra Average 1 10% Poor Below Good Best Location Micro Average 2 10% Poor Below Good Best Location Vista Average 3 5% Poor Below Good Best Average 4 Age 10% Poor Below Good Best Specifications Average 5 15% Poor Below Good Best Amenities Average 6 10% Poor Below Good Best Very Less Max Moderate Demand 7 10% Good Less Very Less Moderate 8 Supply 10% Less Good Max Furnished Average 9 5% Poor Below Good Best 151 to 200 101 to 150 51 to 100 10 B/up 15% <200 50
HEDONIC PRICING MODEL P = f(STLA) The hedonic pricing model is used to estimate the extent to which each factor affects the market price of the property It is most commonly applied to variations in housing prices that reflect the value of local environmental attributes The hedonic principle maintains that humans strive to maximize pleasant feelings and avoid unpleasant feelings
STATISTICS IN HEDONIC PRICING MODEL Time Add 0.75 to 1% per Month Location/Situation Add 10% or more if property is on Main Road Deduct 10% or more if property is Interior Road Near to Market/Business Place Away from Market/Business Place Size Add 10% or more if Size of property is less than comparable property Deductd 10% or more if Size of property is More than comparable property Age Add 10% or more if age of property is less Deduct 10% or more if age of property is less Percentage Factors should be decided by Analysis
ADJUSTMENT GRID MODEL It uses a small number of recently sold properties in the immediate vicinity of the subject property to estimate the value of its attributes Adjustments are calculated by multiplying an adjustment factor times the quantity difference between the subject and comparable Based on Study of Local Market It may be difficult to stand in Court Scrutiny Depends on Perception & Experience of Valuer
STATISTICS IN ADJUSTMENT GRID MODEL Sr No Factors Property Sale 1 Sale 2 Sale 3 Remarks 1 Area 80 110 85 65 2 Rate ? 45000 44000 50000 3 Time 19/06/21 01/05/21 01/03/21 01/01/21 Adjust Time 4 1% 2% 3% 5 Rate 6 Location -2% Nil -5% 7 Size/Area 8% 6% 4% 8 Age Nil 20% 5% Specifications 9 20% Nil 9% Overall Adjust 10 25% 28% 16% 11 Final Adjust 56250 56320 58000
QUALITY REGRESSION TECHNIQUE Regression models provide an alternative that is more flexible and objective A model can be built with numerous variables that are tested for impact on the value of a property Flexibility Objective Approach Sticking to Your Core Competency
QUALITY REGRESSION ANALYSIS Sr No Factor Property Sale 1 Sale 2 Sale 3 Remarks 1 Area 2 Rate/Sqm Time Factor 3 Adjust Time 4 Adjust Rate 5 LVL Factor LVL Factor LVL Factor LVL Factor Weightages LVL Factor 6 7 Location 8 Size/Area 9 Age Specification 10 Income/Rent 11


")