Variability of Flood Risk in Canada Amid Climate Change
Explore the changing flood risk across Canada under climate change, considering impacts of global warming on temperatures, precipitation, and flow patterns. Review potential hydrological models, methodologies for flood frequency analysis, and hydraulic modeling of floodplains.

Uploaded on | 0 Views
Download Presentation

Please find below an Image/Link to download the presentation.
The content on the website is provided AS IS for your information and personal use only. It may not be sold, licensed, or shared on other websites without obtaining consent from the author. If you encounter any issues during the download, it is possible that the publisher has removed the file from their server.
You are allowed to download the files provided on this website for personal or commercial use, subject to the condition that they are used lawfully. All files are the property of their respective owners.
The content on the website is provided AS IS for your information and personal use only. It may not be sold, licensed, or shared on other websites without obtaining consent from the author.
E N D
Presentation Transcript
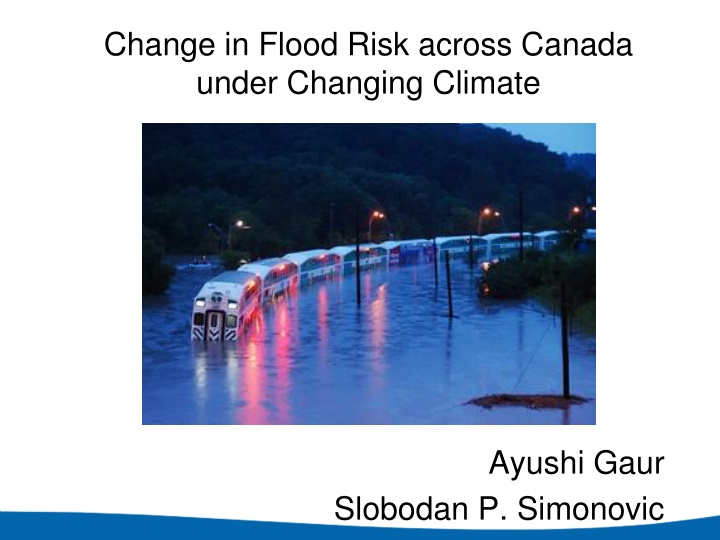
Change in Flood Risk across Canada under Changing Climate Ayushi Gaur Slobodan P. Simonovic
Overview Introduction Literature review Brief tentative methodology Selection of hydrologic model Future work References
Introduction: Global climate change Global temperatures have been found increasing over past 50 years (IPCC, 2007). Role of anthropogenic factors has been found significant (Huber & Knutti, 2011; IPCC, 2007). Changes in flow and flood patterns have been detected (Hirabayashi et al., 2013; Hirabayashi et.al. 2009; Dankers & Feyen, 2009).
Introduction: Climate Change in Canada Changes in temperature and precipitation patterns (Groisman et al., 2002; Shabbar & Bonsal, 2003). Changes in flow patterns (Groisman et al., 2002). Flood risk gradually increasing (Shrubsole, Lacroix, & Simonovic, 2003).
Literature review Criteria for the selection of hydrological model Should be state-of-the-art. Could be used at regional/continental/global scale. Should have a routing and floodplain mapping component. Input data should be readily available. Should operate at a grid-scale.
Findings from literature review List of hydrological models found mostly: HBV Hydrological model Study region HBV Upper Severn catchment (UK) Norway HBV Hindukush-Karakorum-Himalaya (HKH) region, India HBV Nordic countries :(Denmark, Finland, Iceland, Norway, and Sweden) LISFLOOD Europe LISFLOOD Europe LISFLOOD Europe CaMa-Flood Global study CaMa-Flood Amazon river
Methodology (tentative) Climate model and emission scenario selection Downscaling of climate model data Hydrologic and hydraulic model selection and application Flood frequency analysis
Hydraulic modelling of floodplains Flow on floodplains is controlled by topography and friction. Leads to complex spatial patterns of water depth and velocity that are 2D in space and dynamic in time. Until recently modelling of such flows has only been possible for small river reaches (10-50km).
New opportunities Large scale modelling has now been made possible by: Simplified 2D hydraulic models Faster computers New satellite data sources e.g. SRTM, satellite radars
CaMa-Flood Hydrological Model A global-scale model of all rivers, wetlands and lakes on the Earth Very high computational efficiency Realistic surface water dynamics
Steps involved for hydrodynamic process Calculation of flood stage Calculation of River Discharge Flow computation(River channel and floodplains Preparing River Network Map
CaMa-Flood model assumptions 1. Global topography & hydrography data Ground elevation is given by SRTM30 DEM. River networks are given by GDBD (Global Drainage Basin database) flow direction map. 2. Unit-catchment & sub-grid topography River basins are divided to unit-catchments in order to reduce computational cost. Water stage (level, inundated area) is diagnosed from water storage using sub-grid topography. Uniform water level in a unit-catchment. River and floodplain water levels are same
Sub-grid topography is represented by 6 parameters. Catchment area Channel length Channel width Channel depth Floodplain elevation profile Bank-top elevation
CaMa-Flood model assumptions 3. River network map & discharge calculation Water exchange between unit-catchments only occurs along the river network map. A new upscaling method (FLOW) has been proposed, it preserve the river network structure of the original fine resolution flow direction map (Yamazaki et al, 2009). Only one downstream is assigned to each unit-catchment by the river network map. Discharge to downstream is calculated separately for channel and floodplain by using shallow water momentum equation.
CaMa-Flood model assumptions 4. Channel cross-section parameters Channel depth + width are given by a power-low function of mean flow. Channel width can be given from a satellite water body map.
LISFLOOD-FP Hybrid 1D/2D model Based on raster DEM. 1D Kinematic or diffusion wave routing in channel. Once bankfull depth is exceeded calculates a flux to floodplain cells using Manning s equation or 2D diffusive wave to route water over complex floodplain topography. Model discretization of floodplain and channel topography. In-channel flow routed using a 1D wave equation. Once bankfull depth is exceeded water can flow laterally over adjacent low lying floodplains according to topography and free surface gradient.
LISFLOOD-FP Inundation is based on a simple continuity equation: dV = + + + Q Q Q Q up down left right dt where: V = cell volume t = time Qup, Qdown, Qleft and Qright= flow rates in each direction into (positive Q) and out of (negative Q) the cell
LISFLOOD-FP j i Flux between cells calculated using the Manning s equation 2 , / 3 / 1 , 2 A R S i , j i j i j ,= Q i j n where: Qi,j = Ai,j= flux between two cells i and j, cross sectional area at the cell interface, hydraulic radius at cell interface, water surface slope between cells, Manning friction coefficient. Ri,j= Si,j= n =
Data requirements for LISFLOOD-FP Raster Digital Elevation Model: The DEM raster grid allows the representation of floodplain topography. DEM data availability is done by air photogrammetry, airborne laser altimetry(LiDAR) and Interferometric Synthetic Aperture Radar (SAR). Raster grid comes from data acquired by NASA satellite ASTER, which is a Global Digital Model Elevation data set. Inflow Discharge Hydrographs: For boundary conditions of the model , input hydrographs can be obtained by the guaging stations record.
Data requirements for LISFLOOD-FP Channel geometry: It can be taken from the DEM or surveyed cross sections. Also, It can be set individually for each point on the channel vector if necessary. Channel width: Taken from the DEM or surveyed cross sections It can be set individually for each point on the channel vector if necessary. Need not be same as the model grid resolution across the river channel. Bank full depth: It can be taken from the DEM or surveyed cross sections. It can be set individually for each point on the channel vector if necessary.
References IPCC, 2007: Climate Change 2007: The Physical Science Basis. Contribution of Working Group I to the Fourth Assessment Report of the Intergovernmental Panel on Climate Change [Solomon, S., D. Qin, M. Manning, Z. Chen, M. Marquis, K.B. Averyt, M. Tignor and H.L. Miller (eds.)]. Cambridge University Press, Cambridge, United Kingdom and New York, NY, USA, 996 pp. Huber, M., & Knutti, R. (2011). Anthropogenic and natural warming inferred from changes in Earth s energy balance. Nature Geoscience, 5(1), 31 36. doi:10.1038/ngeo1327. Dankers, R., & Feyen, L. (2009). Flood hazard in Europe in an ensemble of regional climate scenarios. Journal of Geophysical Research, 114(D16), D16108. doi:10.1029/2008JD011523. Hirabayashi, Y., Mahendran, R., Koirala, S., Konoshima, L., Yamazaki, D., Watanabe, S., Kanae, S. (2013). Global flood risk under climate change. Nature Climate Change, 3(9), 816 821. doi:10.1038/nclimate1911. Bates,P., Trigg,M., Neal, J., and Dabrowa,A., (2013). LISFLOOD-FP, User manual, School of Geographical Sciences, University of Bristol. University Road, Bristol, BS8 1SS, UK. Retrieved from website: http://www.bristol.ac.uk/media- library/sites/geography/migrated/documents/lisflood-manual-v5.9.6.pdf. Yamazaki, D., Oki, T., and Kanae, S., 2009. Deriving a global river network map and its sub-grid topographic characteristics from a fine-resolution flow direction map. Hydrology and Earth System Sciences, 13, 2241 2251. Yamazaki, D., (2014). The global hydrodynamic model CaMa-Flood (version 3.6.2), Japan Agency for Marine-Earth Science and Technology, retrieved from website: http://hydro.iis.u- tokyo.ac.jp/~yamadai/cama-flood/Manual_CaMa-Flood_v362.pdf


")