Explore a detailed table containing information on countries, continents, years, life expectancy, population, and GDP per capita. The table includes data for Australia, New Zealand, and Switzerland across various years in the 1990s and 2000s, offering insights into demographic and economic trends in Oceania and Europe.
Please find below an Image/Link to download the presentation.
The content on the website is provided AS IS for your information and personal use only. It may not be sold, licensed, or shared on other websites without obtaining consent from the author. If you encounter any issues during the download, it is possible that the publisher has removed the file from their server.
You are allowed to download the files provided on this website for personal or commercial use, subject to the condition that they are used lawfully. All files are the property of their respective owners.
The content on the website is provided AS IS for your information and personal use only. It may not be sold, licensed, or shared on other websites without obtaining consent from the author.
E N D
Presentation Transcript
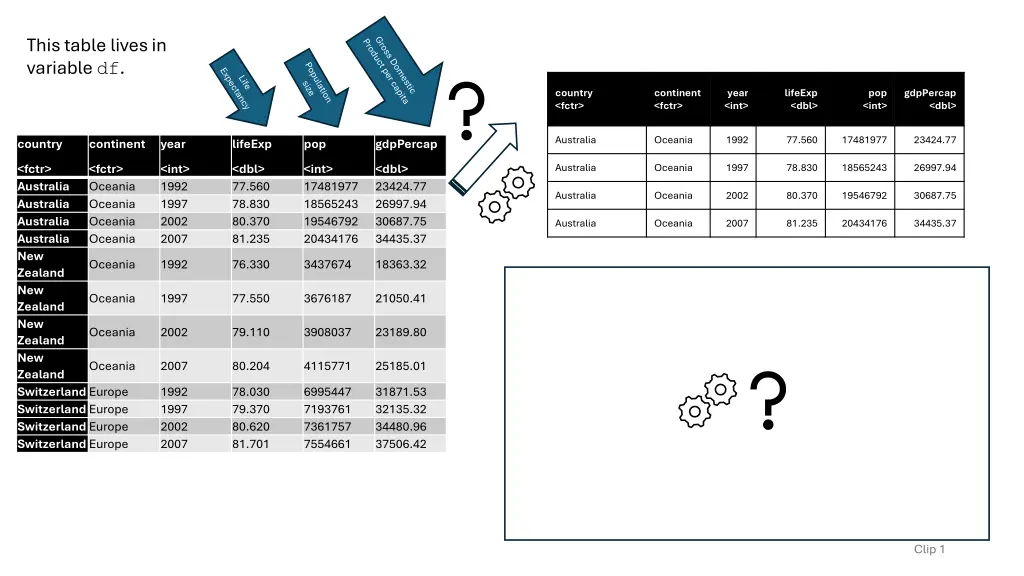
This table lives in variable df. country <fctr> continent <fctr> year <int> lifeExp <dbl> pop <int> gdpPercap <dbl> Australia Oceania 1992 77.560 17481977 23424.77 country continent year lifeExp pop gdpPercap <fctr> Australia Australia Australia Australia New Zealand New Zealand New Zealand New Zealand Switzerland Europe Switzerland Europe Switzerland Europe Switzerland Europe <fctr> Oceania Oceania Oceania Oceania <int> 1992 1997 2002 2007 <dbl> 77.560 78.830 80.370 81.235 <int> 17481977 18565243 19546792 20434176 <dbl> 23424.77 26997.94 30687.75 34435.37 Australia Oceania 1997 78.830 18565243 26997.94 Australia Oceania 2002 80.370 19546792 30687.75 Australia Oceania 2007 81.235 20434176 34435.37 Oceania 1992 76.330 3437674 18363.32 Oceania 1997 77.550 3676187 21050.41 Oceania 2002 79.110 3908037 23189.80 Oceania 2007 80.204 4115771 25185.01 1992 1997 2002 2007 78.030 79.370 80.620 81.701 6995447 7193761 7361757 7554661 31871.53 32135.32 34480.96 37506.42 Clip 1
This table lives in variable df. country continent year lifeExp pop gdpPercap Australia Oceania 1992 77.56 17481977 23424.77 country continent year lifeExp pop gdpPercap <fctr> Australia Australia Australia Australia New Zealand New Zealand New Zealand New Zealand <fctr> Oceania Oceania Oceania Oceania <int> 1992 1997 2002 2007 <dbl> 77.560 78.830 80.370 81.235 <int> 17481977 18565243 19546792 20434176 <dbl> 23424.77 26997.94 30687.75 34435.37 Australia Oceania 1997 78.83 18565243 26997.94 New Zealand Oceania 1992 76.33 3437674 18363.32 New Zealand Oceania 1997 77.55 3676187 21050.41 Switzerland Europe 1992 78.03 6995447 31871.53 Oceania 1992 76.330 3437674 18363.32 Switzerland Europe 1997 79.37 7193761 32135.32 Oceania 1997 77.550 3676187 21050.41 Oceania 2002 79.110 3908037 23189.80 Oceania 2007 80.204 4115771 25185.01 SwitzerlandEurope 1992 78.030 6995447 31871.53 SwitzerlandEurope 1997 79.370 7193761 32135.32 SwitzerlandEurope 2002 80.620 7361757 34480.96 SwitzerlandEurope 2007 81.701 7554661 37506.42 Clip 2
This table lives in variable df. This is a factor country continent year lifeExp pop gdpPercap <fctr> Australia Australia Australia Australia New Zealand New Zealand New Zealand New Zealand <fctr> Oceania Oceania Oceania Oceania <int> 1992 1997 2002 2007 <dbl> 77.560 78.830 80.370 81.235 <int> 17481977 18565243 19546792 20434176 <dbl> 23424.77 26997.94 30687.75 34435.37 Oceania 1992 76.330 3437674 18363.32 Oceania 1997 77.550 3676187 21050.41 Oceania 2002 79.110 3908037 23189.80 Oceania 2007 80.204 4115771 25185.01 Switzerland Europe 1992 78.030 6995447 31871.53 Switzerland Europe 1997 79.370 7193761 32135.32 Switzerland Europe 2002 80.620 7361757 34480.96 Switzerland Europe 2007 81.701 7554661 37506.42 Clip 3
This table lives in variable df. country continent year lifeExp pop gdpPercap <fctr> Australia Australia Australia Australia <fctr> Oceania Oceania Oceania Oceania <int> 1992 1997 2002 2007 <dbl> 77.560 78.830 80.370 81.235 <int> 17481977 18565243 19546792 20434176 <dbl> 23424.77 26997.94 30687.75 34435.37 New ZealandOceania 1992 76.330 3437674 18363.32 New ZealandOceania 1997 77.550 3676187 21050.41 New ZealandOceania 2002 79.110 3908037 23189.80 New ZealandOceania 2007 80.204 4115771 25185.01 Switzerland Europe 1992 78.030 6995447 31871.53 Switzerland Europe 1997 79.370 7193761 32135.32 Switzerland Europe 2002 80.620 7361757 34480.96 Switzerland Europe 2007 81.701 7554661 37506.42 Clip 4
This table lives in variable df. country continent year lifeExp pop gdpPercap <fctr> Australia Australia Australia Australia New Zealand New Zealand New Zealand New Zealand Switzerlan d Switzerlan d Switzerlan d Switzerlan d <fctr> Oceania Oceania Oceania Oceania <int> 1992 1997 2002 2007 <dbl> 77.560 78.830 80.370 81.235 <int> 17481977 18565243 19546792 20434176 <dbl> 23424.77 26997.94 30687.75 34435.37 Oceania 1992 76.330 3437674 18363.32 Oceania 1997 77.550 3676187 21050.41 Oceania 2002 79.110 3908037 23189.80 Oceania 2007 80.204 4115771 25185.01 Europe 1992 78.030 6995447 31871.53 Europe 1997 79.370 7193761 32135.32 Europe 2002 80.620 7361757 34480.96 Europe 2007 81.701 7554661 37506.42 Clip 5
This table lives in variable df. country continent year lifeExp pop gdpPercap <fctr> Australia Australia Australia Australia New Zealand New Zealand New Zealand New Zealand Switzerlan d Switzerlan d Switzerlan d Switzerlan d <fctr> Oceania Oceania Oceania Oceania <int> 1992 1997 2002 2007 <dbl> 77.560 78.830 80.370 81.235 <int> 17481977 18565243 19546792 20434176 <dbl> 23424.77 26997.94 30687.75 34435.37 Oceania 1992 76.330 3437674 18363.32 Oceania 1997 77.550 3676187 21050.41 Oceania 2002 79.110 3908037 23189.80 Oceania 2007 80.204 4115771 25185.01 Europe 1992 78.030 6995447 31871.53 Europe 1997 79.370 7193761 32135.32 Europe 2002 80.620 7361757 34480.96 Europe 2007 81.701 7554661 37506.42 Clip 6
This table lives in variable df. country continent year lifeExp pop gdpPercap <fctr> Australia Australia Australia Australia New Zealand New Zealand New Zealand New Zealand Switzerlan d Switzerlan d Switzerlan d Switzerlan d <fctr> Oceania Oceania Oceania Oceania <int> 1992 1997 2002 2007 <dbl> 77.560 78.830 80.370 81.235 <int> 17481977 18565243 19546792 20434176 <dbl> 23424.77 26997.94 30687.75 34435.37 Oceania 1992 76.330 3437674 18363.32 Oceania 1997 77.550 3676187 21050.41 Oceania 2002 79.110 3908037 23189.80 Oceania 2007 80.204 4115771 25185.01 Europe 1992 78.030 6995447 31871.53 Europe 1997 79.370 7193761 32135.32 Europe 2002 80.620 7361757 34480.96 Europe 2007 81.701 7554661 37506.42 Clip 7
This table lives in variable df. country continent year lifeExp pop gdpPercap <fctr> Australia Australia Australia Australia New Zealand New Zealand New Zealand New Zealand Switzerlan d Switzerlan d Switzerlan d Switzerlan d <fctr> Oceania Oceania Oceania Oceania <int> 1992 1997 2002 2007 <dbl> 77.560 78.830 80.370 81.235 <int> 17481977 18565243 19546792 20434176 <dbl> 23424.77 26997.94 30687.75 34435.37 Oceania 1992 76.330 3437674 18363.32 Oceania 1997 77.550 3676187 21050.41 Oceania 2002 79.110 3908037 23189.80 Oceania 2007 80.204 4115771 25185.01 Europe 1992 78.030 6995447 31871.53 Europe 1997 79.370 7193761 32135.32 Europe 2002 80.620 7361757 34480.96 Europe 2007 81.701 7554661 37506.42 Clip 8
This table lives in variable df. country continent year lifeExp pop gdpPercap GDP Australia Oceania 1992 77.560 17481977 23424.77 409511234952 Australia Oceania 1997 78.830 18565243 26997.94 501223252921 country continent year lifeExp pop gdpPercap Australia Oceania 2002 80.370 19546792 30687.75 599847158654 <fctr> Australia Australia Australia Australia New Zealand New Zealand New Zealand New Zealand Switzerlan d Switzerlan d Switzerlan d Switzerlan d <fctr> Oceania Oceania Oceania Oceania <int> 1992 1997 2002 2007 <dbl> 77.560 78.830 80.370 81.235 <int> 17481977 18565243 19546792 20434176 <dbl> 23424.77 26997.94 30687.75 34435.37 Australia Oceania 2007 81.235 20434176 34435.37 703658358894 New Zealand Oceania 1992 76.330 3437674 18363.32 63127124700 Oceania 1992 76.330 3437674 18363.32 New Zealand Oceania 1997 77.550 3676187 21050.41 77385257446 Oceania 1997 77.550 3676187 21050.41 New Zealand Oceania 2002 79.110 3908037 23189.80 90626601698 Oceania 2002 79.110 3908037 23189.80 New Zealand Oceania 2007 80.204 4115771 25185.01 103655730130 Oceania 2007 80.204 4115771 25185.01 Switzerland Europe 1992 78.030 6995447 31871.53 222955601023 Switzerland Europe 1997 79.370 7193761 32135.32 231173833392 Europe 1992 78.030 6995447 31871.53 Switzerland Europe 2002 80.620 7361757 34480.96 253840431788 Europe 1997 79.370 7193761 32135.32 Switzerland Europe 2007 81.701 7554661 37506.42 283348281398 Europe 2002 80.620 7361757 34480.96 Europe 2007 81.701 7554661 37506.42 Clip 9
This table lives in variable df. country continent year lifeExp pop gdpPercap <fctr> Australia Australia Australia Australia New Zealand New Zealand New Zealand New Zealand Switzerlan d Switzerlan d Switzerlan d Switzerlan d <fctr> Oceania Oceania Oceania Oceania <int> 1992 1997 2002 2007 <dbl> 77.560 78.830 80.370 81.235 <int> 17481977 18565243 19546792 20434176 <dbl> 23424.77 26997.94 30687.75 34435.37 Oceania 1992 76.330 3437674 18363.32 Oceania 1997 77.550 3676187 21050.41 Oceania 2002 79.110 3908037 23189.80 Oceania 2007 80.204 4115771 25185.01 Europe 1992 78.030 6995447 31871.53 Europe 1997 79.370 7193761 32135.32 Europe 2002 80.620 7361757 34480.96 Europe 2007 81.701 7554661 37506.42 Clip 10