Vector Color Coding and Displacement Plots in Vector Fields
Explore vector color coding and displacement plots in vector fields to visualize trajectories and surface warping. Understand the representation of vectors in terms of orientation, magnitude, and surfaces in a visually continuous manner. Discover the use of stream objects to display trajectories at different time intervals, as well as streamlines in time-dependent and time-independent vector fields.

Download Presentation

Please find below an Image/Link to download the presentation.
The content on the website is provided AS IS for your information and personal use only. It may not be sold, licensed, or shared on other websites without obtaining consent from the author.If you encounter any issues during the download, it is possible that the publisher has removed the file from their server.
You are allowed to download the files provided on this website for personal or commercial use, subject to the condition that they are used lawfully. All files are the property of their respective owners.
The content on the website is provided AS IS for your information and personal use only. It may not be sold, licensed, or shared on other websites without obtaining consent from the author.
E N D
Presentation Transcript
CHAPTER 6 (2) VECTOR COLOR CODING
6.3 VECTOR COLOR CODING Fig 6.10 Vector color coding in Hue-Saturation-Value Rep. (a) Orientation (H) and magnitude(V); (b) Orientation only. at Right: color wheel : Hue:angle + full Saturation: dis. from center; Value: separate
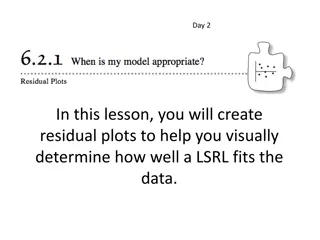
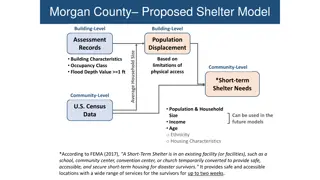
6.4 DISPLACEMENT PLOTS Vector glyphs can be understood in terms of displaying trajectories Each glyph shows both the start and end points of the trajectory, p and p+v(p) t Displacement plots (comparison) Different approach by showing only the end points of such trajectories Given a surface S, where S is discretized as a set of sample points Pi A displacement plot of S is a new surface S1 given by: i = + v( ) i p k p p i
6.4 DISPLACEMENT PLOTS Displacement plot Think of it as being the effect of displacing or warping, a given surface in the vector field Advantage: produce a visually continuous result Disadvantage: more abstract, less intuitive (particularly poor when dis. is along surface) Several elements control the quality Displacement factor K The shape and position of the surface to be warped Plane, & other geometric objects.
6.4 DISPLACEMENT PLOTS Fig 6.12 Displacement plots of planar surfaces in a 3D vector field. (clolor shows the dis. length along the surface normal direction)
6.4 DISPLACEMENT PLOTS Fig 6.13 Displacement plots using a box & a spherical surface (color shows velocity magnitude)
6.5 STREAM OBJECTS Vector glyphs trajectories over a short T Displacement plots -- trajectories at the end points Stream objects -- using trajectories computed for longer time intervals
6.5 STREAM OBJECTS 6.5.1 STREAMLINES Streamlines Streamline: curved path, time-independent Time-dependent vector field: CFD, function of both space and time Time-independent vector field: function only of space, stationary
6.5.1 STREAMLINES Fig 6.14 Streamlines in a 2D flow field * The small gray balls indicate the seed points * in 18*9 samples ; color shows velocity magnitude (blue=>red)
6.5.1 STREAMLINES Listing 6.1. Streamline tracing
6.5 STREAM OBJECTS 6.5.2 STREAM TUBES Stream tubes Can be constructed by sweeping a circular cross-section along the streamline curve The thickness or radius, parameter of stream tubes can also be used to convey some extra information The degree of freedom has some limitations
6.5 STREAM OBJECTS 6.5.2 STREAM TUBES Fig 6.15 Stream tubes with arrow heads. The construction is with (a) the seed points (b) the arrow heads arranged on a regular grid
6.5 STREAM OBJECTS 6.5.2 STREAM TUBES Fig 6.16 Stream tubes with radius and luminance modulated by normalized tube length
6.5 STREAM OBJECTS 6.5.3 STREAMLINES AND TUBES IN 3D DATASETS Choosing an appropriate sampling strategy is more critical when tracing streamline in 3D datasets compared to 2D solves the coverage, Density continuity issues Stream tubes have advantage Providing some shading and occlusions cues Allow us to better determine their actual relative position and orientation in 3D vector visualization
6.5.3 STREAMLINES AND TUBES IN 3D DATASETS Fig 6.17 Streamlines in a 3D flow dataset
6.5.3 STREAMLINES AND TUBES IN 3D DATASETS Fig 6.18 Stream tubes traced from a seed area placed at the flow inlet
6.5 STREAM OBJECTS 6.5.4 STREAM RIBBONS Stream ribbons Created by launching two streamlines from two seed points close to each other Surface created by the lines of minimal length with endpoints on the two streamline is called a stream ribbon If the two streamlines stay relatively close to each other, then the stream ribbon s twisting around its center curve gives a measure of the twisting of the vector field around the direction of advection
6.5.4 STREAM RIBBONS Fig 6.19 Stream ribbons in a 3D flow dataset: (a) Two thick ribbons; (b) 20 thin ribbons.
6.5 STREAM OBJECTS 6.5.5 STREAM SURFACES Stream surfaces Stream ribbons can be used to visualize how the curve would be advected in the vector field Stream ribbons can be generalized to compute so-called stream surfaces of the vector field The intuitive property: the flow described by the vector field is always tangent to the surface Easier to follow visually Can be constructed in several ways
6.6 TEXTURE-BASED VECTOR VISUALIZATION Discrete -- Vector glyphs; Streamlines; Stream surfaces Continuous: Texture-Based Vector Visualization Create a texture signal that encodes the direction and magnitude of a vector field by Luminance, graininess, color and pattern structure Challenge: how to encode the vector direction in the texture parameters graininess
6.6 TEXTURE-BASED VECTOR VISUALIZATION Fig 6.20 Line Integral Convolution principle. The color T(p) of pixel p is given by integrating the colors of a noise texture N along the streamline S(p, s) passing through p. The red color intensity along S shows the magnitude of the weight function k(s).
6.6 TEXTURE-BASED VECTOR VISUALIZATION Fig 6.21 Line Integral Convolution visualization (a) Input noise; (b) The resulting LIC texture.
6.6 TEXTURE-BASED VECTOR VISUALIZATION 6.6.1 IBFV METHOD IBFV method One of texture-based vector visualization methods Image Based Flow Visualization (IBFV) Produce not just static but animated flow texture in real time Handle stationary and instationary fields Domains ranging from 2D to volumetric one Simple to implement
6.6 TEXTURE-BASED VECTOR VISUALIZATION 6.6.1 IBFV METHOD Fig 6.22 Principle of image-based flow visualization (IBFV)
6.6 TEXTURE-BASED VECTOR VISUALIZATION 6.6.3 EXAMPLES 2D Fig 6.24 (a) Texture-based visualization with color-coded velocity magnitude. (b) Texture-based visualization with luminance-coded velocity magnitude and three ink sources.
6.7 SIMPLIFIED REPRESENTATION OF VECTOR FIELDS Do not visualize all the data points in the same way Regions that exhibit important characteristic for an application area, should be visualized in different ways compared to the less important ones Vortices, Speed extrema, Separation lines between regions of lamina flow Simplified version The sheer size of the data
6.7 SIMPLIFIED REPRESENTATION OF VECTOR FIELDS 6.7.1 FEATURE DETECTION METHODS Feature detection methods reduce the vector field to a set of features of interest Feature type, position, extent, and strength Feature defined Analytically by a feature energy-like function A set of examples or patterns Some problems Hard to define precise numerical criteria to detect such features Appear at different spatial scales in vector fields No clear spatial separation between a feature and a non-feature area
6.7 SIMPLIFIED REPRESENTATION OF VECTOR FIELDS 6.7.2 FIELD DECOMPOSITION METHODS Partition the vector dataset into regions of strong intra-region (internal) weak inter-region similarity Core: similarity metric f that defines how similar two regions are Different metric -> different decomposition A frequently used: compares the direction and magnitude of the vector data Usually perform a top-down partitioning or bottom-up agglomerative clustering of dataset
6.7 SIMPLIFIED REPRESENTATION OF VECTOR FIELDS 6.7.2 FIELD DECOMPOSITION METHODS Fig 6.26 Simplified vector field visualization via bottom-up clustering of (a) a 2D field and (b) a 3D field.
6.7 SIMPLIFIED REPRESENTATION OF VECTOR FIELDS 6.7.2 FIELD DECOMPOSITION METHODS AMG: the Algebraic MultiGrid The idea of producing a hierarchy of bases that approximates a given vector field at several levels of detail Fig 6.27 Vector field decomposition using the AMG technique. Three decomposition levels are visualized
6.7 SIMPLIFIED REPRESENTATION OF VECTOR FIELDS 6.7.2 FIELD DECOMPOSITION METHODS Fig 6.28 AMG-based simplified visualization of wind vector field on the surface of the Earth
6.8 CONCLUSION A number of visualization methods for vector fields From simple visual representations, straightforward implementation : vector glyph To multiscale textures animated in real time, complex implementations: MIBFV (Image-Based Flow Vis.) Another classification method: based on the dimensionality of the data domain 2D surface: planar or curved ones 3D volumetric vector fields, more challenging Inherent occlusion of the visualization primitives The challenge of creating insightful visualization of 3D time- dependent vector fields describing complex phenomena is still an active area of research
OUTLINE Vector Visualization: Applications: e.g. Computational Fluid Dynamics (CFD) 6.1 Mathematical operators to analyze vector fields -- Divergence ( ) & Verticity ( ) 6.2 Vector glyphs 6.3 Color Mapping techniques to depict vector fields 6.4 Displacement plot technique 6.5 Stream objects 6.6 Texture-based techniques 6.7 Strategies for simplified representation of vector datasets : Feature extract; Field Decomposition
END ! END ! listing 6.2 IBFV implementation in OpenGL
")