Vesatolimod Enhancement of Innate-Adaptive Cell Cross-talk in HIV Controllers
Evidence from a proteomic study highlights how Vesatolimod enhances communication between innate and adaptive immune cells in HIV controllers on antiretroviral therapy. The research explores the impact of Vesatolimod on viral rebound, immune responses, and biomarker levels, offering insights into potential therapeutic strategies for managing HIV.

Download Presentation

Please find below an Image/Link to download the presentation.
The content on the website is provided AS IS for your information and personal use only. It may not be sold, licensed, or shared on other websites without obtaining consent from the author. If you encounter any issues during the download, it is possible that the publisher has removed the file from their server.
You are allowed to download the files provided on this website for personal or commercial use, subject to the condition that they are used lawfully. All files are the property of their respective owners.
The content on the website is provided AS IS for your information and personal use only. It may not be sold, licensed, or shared on other websites without obtaining consent from the author.
E N D
Presentation Transcript
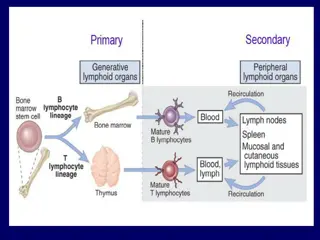
Proteomic Evidence of Vesatolimod-induced Enhancement of Cross-talk Between Innate and Adaptive Response Cells in HIV Controllers on ART Yanhui Cai1, Steven G. Deeks2, Cynthia Brinson3, Moti Ramgopal4, Norm Jones2, Edwin DeJesus5, Anthony Mills6, Peter Shalit7, Brian Moldt1, Liao Zhang1, Gesham Magombedze1, Elena Vendrame1, Devi SenGupta1, Ondrej Podlaha1, Jeffrey J. Wallin1 1Gilead Sciences, Foster City, CA, USA; 2University of California San Francisco;3Central Texas Clinical Research, Austin, TX; 4Midway Research Center, Fort Pierce, FL; 5Orlando Immunology Center, Orlando, FL; 6Men s Health Foundation, West Hollywood, CA; 7Peter Shalit MD and Associates, Seattle, WA IAS 2021, 18 21 July: Abstract 02171
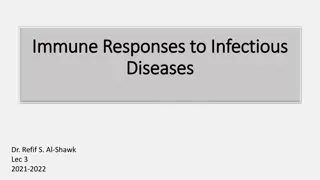
Study Design for Oral VES in HIV Controllers on ART RNA Rebound 200 c/mL Day 1 Week 20 24 48 100 HIV controllers on ART 6 months N=25 Pre-ART VL 50 5000 c/mL Placebo HIV RNA Rebound, % ATI 80 2:1 Participants With (24+ wk) VES QOW 4 8 mg x 10 4 mg (n=2) 4 6 mg (n=4) 6 mg (n=5) 60 40 Placebo (n=8) VES (n=15) Log-rank p=0.024 20 6 8 mg (n=3) 8 mg (n=3) 0 0 4 8 12 16 32 Week Viral and immunologic outcomes A modest increase in time to viral rebound*, as well as a decrease in viral set point and intact proviral DNA1 Induction of dose-dependent interferon response and increased immune-cell activation2 O-link Proteomic Analysis Soluble biomarkers significantly elevated following VES dose (Wilcoxon rank-sum test) Inferred pathway analysis ART, antiretroviral therapy; ATI, analytic treatment interruption; c, copies; VES, vesatolimod; VL, viral load. *Time to virologic rebound = wk from start of ATI to 2 consecutive HIV-1 RNA 200 c/mL. 1. SenGupta D, et al. CROI 2020, abstract 3982; 2. Wallin J, et al. AIDS 2020, abstract OAB0205. 2
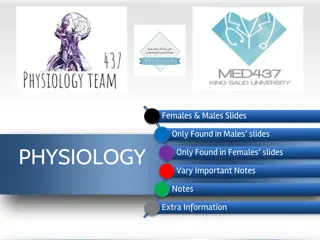
VES Activates the Innate Immune Response CD69+ NK CD16+ NK CD40 expression on pDC CD14+CD16+ Monocyte 50 1500 100 30 40 80 % CD14+CD16+ monocyte GMFI CD40 on pDC 1300 %CD16+NK % CD69+NK 30 60 20 1100 20 40 20 10 10 900 0 Day 0 0 1 3 13 700 Day 0 1 3 13 Day 0 1 3 13 0 Day 0 1 3 13 ** 50 100 *** ** ** *** 2200 40 30 80 % CD16+NK GMFI CD40 on pDC * % CD14+CD16+monocyte % CD69+NK 30 ** 1700 60 20 20 40 1200 10 10 20 0 0 0 700 Dose Post-dose 0 0 Dose Post-dose 4 1-day 10 4 10 1-day 10 10 Dose Post-dose 0 4 0 4 1-day 13-day 0 6 0 6 10 10 4 10 4 10 10 10 10 Dose 10 0 0 4 1-day 10 4 10 1-day 10 10 13-day 13-day 3-day 13-day 3-day 13-day 1-day 13-day Post-dose 13-day 13-day 3
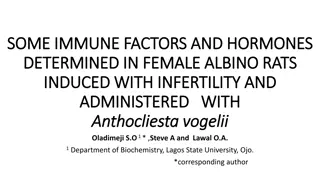
VES Significantly Increased Markers of Adaptive Immune Response CD38+CD8+ Ki67+ CD4+ CD69+CD8+ HLA-DR+CD38+ CD4+ 9 70 8 17 CD69+CD8+ T Cells % CD38+CD8+ T Cells % Ki67+CD4+ T Cells % HLA-DR+CD38+ 10 7 6 CD4+ T Cells 50 7 5 4 5 30 3 3 2 1 % 1 10 0 Day Day Day 0 1 3 13 0 1 3 13 0 1 3 13 Day 0 1 3 13 *** ** 17 ** 70 * 9 **** ** * ** 6 % CD38+CD8+ T Cells % Ki67+CD4+ T Cells %CD69+CD8+T Cells 10 % HLA-DR+CD38+ 7 8 CD4+ T Cells 50 4 6 5 30 4 2 3 2 10 1 0 0 Dose Post-dose 0 4 6 10 3-day 10 0 4 6 10 10 4 0 4 Dose Post-dose 0 10 10 10 10 Dose Post-dose 0 4 10 10 0 4 1-day 13-day 10 10 Dose Post-dose 0 4 10 10 0 4 10 1-day13-day 10 13-day 3-day 13-day 1-day 13-day 1-day 13-day 1-day 13-day 13-day 1-day 4
Soluble Proteins Increased Significantly 1 Day After VES Administration 1 Day After Dose 1 p Value Significant Symbol 0.006 <0.001 0.004 0.002 0.003 0.000 0.001 0.009 0.005 0.007 0.006 0.009 0.002 <0.001 0.003 0.002 0.003 0.003 0.004 0.009 0.019 <0.001 <0.001 1 Day After Dose 10 p Value Significant symbol 0.013 <0.001 0.016 <0.001 0.016 <0.001 0.011 0.013 <0.001 <0.001 0.007 0.040 0.019 <0.001 <0.001 0.019 0.008 0.013 0.007 0.023 0.034 <0.001 0.001 CD27 Molecule (CD27) CD8 Alpha Chain (CD8A) ** *** ** ** ** *** ** ** ** ** ** ** ** *** ** ** ** ** ** ** * *** *** * *** * *** * *** * * *** *** ** * * *** *** * ** * ** * * *** ** Cytotoxic and Regulatory T Cell Molecule (CRTAM) Macrophage Colony-Stimulating Factor 1 (CSF-1) Fractalkine (CX3CL1) C-X-C Motif Chemokine 10 (CXCL10) C-X-C Motif Chemokine 11 (CXCL11) C-X-C Motif Chemokine 13 (CXCL13) C-X-C Motif Chemokine 9 (CXCL9) Fas Ligand (FASLG) Galectin 9 (Gal-9) Interferon Gamma (IFN- ) Interleukin 10 (IL-10) Interleukin 12 (IL-12) Interleukin 12 Receptor Subunit Beta 1 (IL-12RB1) Interleukin 15 (IL-15) Lysosome Associated Membrane Glycoprot 3 (LAMP3) C-C Motif Chemokine 8 (MCP-2) Programmed Cell Death 1 Ligand 1 (PD-L1) Programmed Cell Death 1 Ligand 2 (PD-L2) Pleiotrophin (PTN) Tumor Necrosis Factor (TNF) Tumor Necrosis Factor Ligand S family 10 (TRAIL) 5
Changes in Inferred Pathways and Immune Responses Associated with VES Treatment Inferred Immune Responses Inferred Pathways Changes Following VES Treatment Coverage % 19.10 Crosstalk between Dendritic Cells and Natural Killer Cells T cell migration 13.10 Tumor Microenvironment Pathway Cell movement of T lymphocytes 14.30 TREM1 Signaling 6.81 Natural Killer Cell Signaling Chemotaxis of T lymphocytes 31.70 Role of Hypercytokinemia/hyperchemokinemia in Influenza Pathogenesis T cell homeostasis 6.49 Chemokine Signaling T cell development 14.50 Th1 Pathway Adhesion of T lymphocytes 3.66 Colorectal Cancer Metastasis Signaling 5.09 Systemic Lupus Erythematosus In T Cell Signaling Pathway Differentiation of T lymphocytes 6.56 Necroptosis Signaling Pathway 0 1 2 3 4 3.39 IL-15 Production z-score Z-score 2.61 IRF Activation by Cytosolic Pattern Recognition Receptors 12.80 Erythropoietin Signaling Plasma proteomic changes revealed: A significant enrichment of pathways associated with immune responses following VES treatment, which included pathways involved in T cell differentiation, recruitment, and migration VES treatment resulted in enrichment in pathways involved in the crosstalk between dendritic cells and NK cells, NK cell signaling, Th1 pathway, and antiviral responses -4 -2 0 2 4 Z-score Only those with Z 1.96 or -1.96 are shown. 6
Inferred Functional Changes Associated with Delayed Viral Rebound in VES-treated HIV Controllers Inflammatory response Migration of lymphatic system cells Coverage % Cell movement of lymphatic system cells IL-15 Production 3.39 Chemotaxis of lymphocytes Chemotaxis of mononuclear leukocytes Pancreatic Adenocarcinoma Signaling 4.63 Lymphocyte migration Neuroinflammation Signaling Pathway 6.19 Cell movement of lymphocytes Cell movement of mononuclear leukocytes PD-1, PD-L1 cancer immunotherapy pathway 9.71 Cell movement of eosinophils Cell movement of leukemia cell lines -2 0 2 Chemotaxis of leukemia cell lines Z-score Homing of leukemia cell lines Only those with Z 1.96 or -1.96 are shown. Chemotaxis of tumor cell lines Homing of tumor cell lines Response of lymphocytes Biomarkers and pathways associated with inflammation were lower in VES-treated participants with delayed viral rebound (defined as plasma viral load <50 c/mL for 6 weeks, n=4) compared to VES-treated participants who rebounded sooner than 6 weeks Participants with delayed rebound showed enrichment in pathways associated with lymphocyte responses and decrease in pathways associated with impaired effector function Activation of myeloid cells Recruitment of leukocytes Attraction of cells Recruitment of blood cells Recruitment of cells Binding of cell surface Chemotaxis of T lymphocytes Cell movement of T lymphocytes T cell migration -4 -2 0 2 4 7 Z-score
HIV Controllers According to Viral Data Modeling Outcomes Ranking of Predictors Day 1 Week 20 24 48 0.5 0.4 % Importance Placebo (n=8) PLWH controllers on ART 6 months (N=25) Pre-ART VL 50 5000 c/mL ATI 2:1 0.3 (24+ wk) VES QOW 4 8 mg x 10 (n=17) 0.2 0.1 0.0 1 2 3 4 Peak Slope-1 Time to Peak Time to Rebound Viral Load Dynamic during ATI Controller: Off ART plasma HIV-1 RNA 400 c/mL for 2/3 of time points for 24 weeks 25% 65% 75% 35% 8
Inferred Pathway Changes Associated with HIV Viral Controllers Coverage % 1.36 3.33 3.42 5.19 8.00 1.35 6.67 3.26 2.84 6.49 5.88 50.00 4.55 5.08 6.38 8.11 13.90 43.50 4.40 5.47 4.17 18.70 3.08 5.90 3.64 6.77 13.20 12.90 18.80 15.10 8.99 Senescence Pathway IL-15 Production Cholecystokinin/Gastrin-mediated Signaling IL-15 Signaling FAT10 Cancer Signaling Pathway CREB Signaling in Neurons STAT3 Pathway Acute Phase Response Signaling Type I Diabetes Mellitus Signaling Chemokine Signaling HIF1a Signaling Differential Regulation of Cytokine Production in Macrophages and Th Cells by IL-17A and IL-17F Role of PKR in Interferon Induction and Antiviral Response p38 MAPK Signaling Death Receptor Signaling Role of MAPK Signaling in Inhibiting the Pathogenesis of Influenza TREM1 Signaling Differential Regulation of Cytokine Production in Intestinal Epithelial Cells by IL-17A and IL-17F Inhibition of ARE-Mediated mRNA Degradation Pathway IL-6 Signaling Cardiac Hypertrophy Signaling (Enhanced) Crosstalk between Dendritic Cells and Natural Killer Cells Dendritic Cell Maturation Neuroinflammation Signaling Pathway Hepatic Fibrosis Signaling Pathway Regulation Of The Epithelial Mesenchymal Transition By Growth Factors Pathway HMGB1 Signaling Tumor Microenvironment Pathway Role of Hypercytokinemia/hyperchemokinemia in the Pathogenesis of Influenza IL-17 Signaling Systemic Lupus Erythematosus In B Cell Signaling Pathway -5 -4 -3 Z-score -2 -1 0 Only those with Z 1.96 or -1.96 are shown. 9
Conclusions High-throughput proteomic analysis approach allowed for exploration of mechanisms associated with VES treatment outcomes VES cumulatively induced innate and adaptive immune cell activation in HIV controllers NK effector function may also be increased Extensive shifts in immune function after VES administration Evidence of cross-talk between innate and adaptive immune responses Lower inflammatory response in those participants with delayed HIV rebound ( 6 weeks) or viral controllers* These findings support the hypothesis that achievement of post-ART HIV control requires a combination of increased cellular immune responses coupled with a balanced inflammatory response *Off ART plasma HIV-1 RNA 400 copies/mL for 2/3 of time points for 24 weeks. 10
Acknowledgments We extend our thanks to the participants, their partners and families. Special thanks to the study teams. Principal Investigator: Steven Deeks Clinical Investigators: Moti Ramgopal, Cynthia Brinson, Edwin DeJesus, Anthony Mills, Peter Shalit Biomarker/Microbiome Analysis: UCSF Core Immunology Lab: Norman Jones, Valerie Girling Accelevir Diagnostics: Gregory Laird Gilead: Ondrej Podlaha, Jeff Wallin, Liao Zhang, Peter Shweh, Brian Moldt, Gesham Magombedze, Romas Geleziunas, Elena Vendrame, and Devi SenGupta These studies were funded by Gilead Sciences, Inc. 11