Explore the fundamentals of vibration data analysis, force response spectrum, single-degree-of-freedom systems, Rayleigh peak response formula, and steady-state response to applied forces. Learn about SDOF systems subjected to various forces and the calculation of peak responses. Discover how different forces affect displacement and frequency in vibrating systems.
Please find below an Image/Link to download the presentation.
The content on the website is provided AS IS for your information and personal use only. It may not be sold, licensed, or shared on other websites without obtaining consent from the author. If you encounter any issues during the download, it is possible that the publisher has removed the file from their server.
You are allowed to download the files provided on this website for personal or commercial use, subject to the condition that they are used lawfully. All files are the property of their respective owners.
The content on the website is provided AS IS for your information and personal use only. It may not be sold, licensed, or shared on other websites without obtaining consent from the author.
E N D
Presentation Transcript
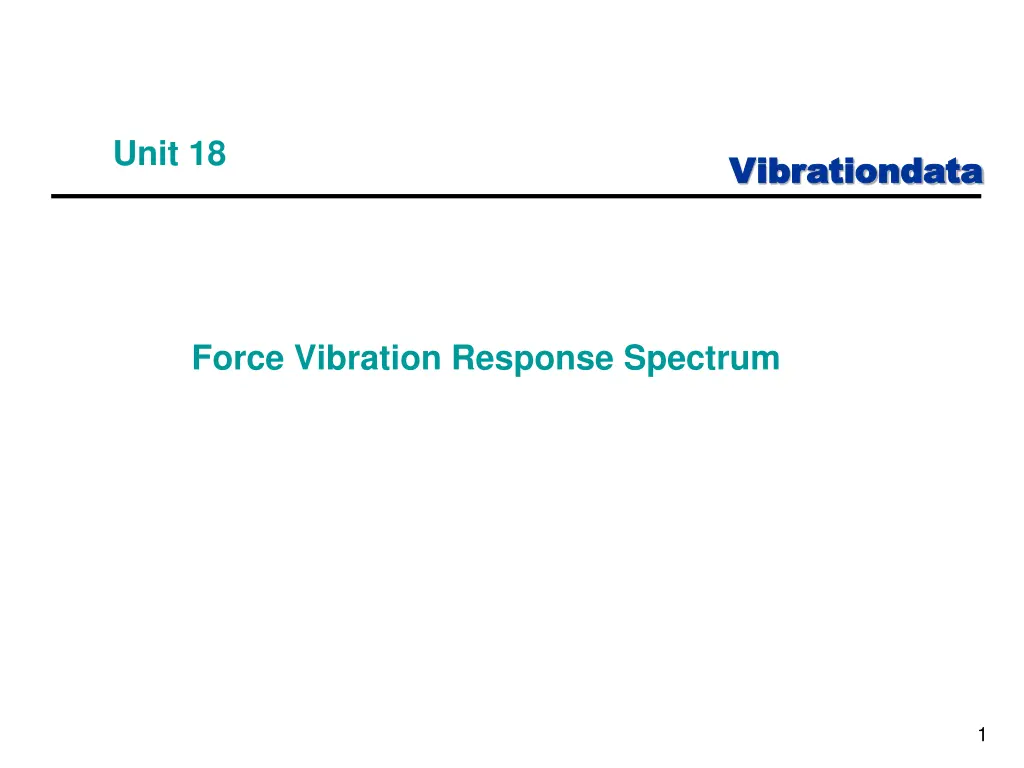
Unit 18 Vibrationdata Vibrationdata Force Vibration Response Spectrum 1
Introduction Vibrationdata Vibrationdata SDOF systems may be subjected to an applied force Modal testing, impact or steady-state force Wind, fluid, or gas pressure Acoustic pressure field Rotating or reciprocating parts Rotating imbalance Shaft misalignment Bearings Blade passing frequencies Electromagnetic force, magnetostriction 2
SDOF System, Applied Force Vibrationdata Vibrationdata m = mass c = viscous damping coefficient k = stiffness x = displacement of the mass f(t) = applied force Governing equation of motion + + = m x c x kx ) t ( f 3
Rayleigh Peak Response Formula Vibrationdata Vibrationdata Consider a single-degree-of-freedom system with the index n. The maximum response can be estimated by the following equations. ( ) = c 2 ln fn T n . 0 5772 = + C c n n c n = C Maximum Peak n n fn T ln is the natural frequency is the duration is the natural logarithm function is the standard deviation of the oscillator response n 4
Vibrationdata Vibrationdata Steady-State Response to Sine Force The normalized displacement is k x 1 = ) ( F 2 ( )2 2 + 1 2 where F is the applied force magnitude The natural frequency fnis = f n f / 1 k m = fn 2 f is the applied force frequency fn is the natural frequency 5
Vibrationdata Vibrationdata Steady-State Response to Sine Force (cont) The transmitted force to ground ratio is ( ) 2 + 1 2 F t = f n f / = , ) ( F 2 ( )2 2 + 1 2 where Ftis the transmitted force magnitude F is the applied force magnitude The transmitted force ratio is the same as that for the acceleration response to base excitation. 6
SDOF STEADY-STATE RESPONSE TO APPLIED SINUSOIDAL FORCE 20 Q = 10 Q = 2 10 Vibrationdata Vibrationdata Q = 1 DISPLACEMENT MAGNITUDE [ k x / F ] 1 0.1 0.01 0.1 1 10 FREQUENCY ( f / fn ) Control by Frequency Domain Low Freq Resonance High Freq Stiffness Damping Mass 7
SDOF STEADY-STATE TRANSMITTED FORCE Vibrationdata Vibrationdata Q = 10 Q = 2 Q = 1 20 10 TRANS FORCE MAG | Ft / F | 1 0.1 0.01 0.1 1 10 FREQUENCY ( f / fn ) 8
Exercise Vibrationdata Vibrationdata vibrationdata > Miscellaneous Functions > SDOF Steady-State Response to Sine Excitation Practice some sample calculations for applied force using your own parameters. Try resonant excitation and then +/- one octave separation between the excitation and natural frequencies. 9
Accelerance Vibrationdata Vibrationdata An accelerance FRF curve is shown for a sample system in the next slide The normalized accelerance converges to 1 as the excitation frequency becomes much larger than the natural frequency The acceleration response would be infinitely high for a white noise force excitation which extended up to an infinitely high frequency 11
Vibrationdata Vibrationdata SDOF Response to Force PSD, Miles Equation The overall displacement x is / 1 2 / 1 4 / 3 4 A 1 1 = xRMS 8 m k where m k is the mass is the stiffness is viscous damping ratio is the amplitude of the force PSD in dimensions of [force^2 / Hz] at the natural frequency A Miles equation assumes that the PSD is white noise from 0 to infinity Hz. 12
Vibrationdata Vibrationdata SDOF Response to Force PSD, General Method Displacement N 1 1 ( ) = i x , = f F f ( ) f ) ( = , f f / RMS n PSD i i i i n 2 k ( ) 2 2 + 1 1 2 i i Velocity N 2 k f 2 ( ) = i i x , = f F f ( ) f ) ( RMS n PSD i i 2 ( ) 2 2 + 1 1 2 i i 13
Vibrationdata Vibrationdata SDOF Response to Force PSD, General Method Acceleration N 4 2 k f 4 = ( ) , f f / = i i x , = i i n f F f ( ) f ) ( RMS n PSD i i 2 ( ) 2 2 + 1 1 2 i i Transmitted Force ( ) ) N 2 + 1 2 ( ) = i i tF , = f F f ( ) f ( RMS n PSD i i 2 ( ) 2 2 + 1 1 2 i i 14
Force PSD Vibrationdata Vibrationdata Frequency (Hz) Force (lbf^2/Hz) 10 0.1 1000 0.1 Duration = 60 sec The same PSD was used for the time domain calculation in Webinar 17. 15
Vibrationdata Vibrationdata SDOF Example Apply the Force PSD on the previous slide to the SDOF system. Duration = 60 seconds (but only affects peak value) Mass = 20 lbm, Q=10, Natural Frequency = independent variable 16
SDOF Response to Force PSD, Acceleration Vibrationdata Vibrationdata Response at 400 Hz agrees with time domain result in previous webinar unit. fn (Hz) Accel (GRMS) 100 0.80 200 1.0 400 1.3 vibrationdata > Power Spectral Density > Force > SDOF Response to Force PSD 17


")