Vibration Signal Analysis for Gearbox Failure Classification
Gearboxes play a crucial role in power transmission, and early detection of faults is essential for safety and maintenance cost reduction. This study focuses on using vibration signals to classify mechanical faults in spur gearboxes, comparing Random Forest and KNN classification methods based on condition indicators. The methodology includes data extraction, feature selection, and severity classification, aiming to efficiently assess fault severity levels. The testing bench setup involves various sensors, and faults types such as Break, Crack, Pitting, and Scuffing are analyzed. Signal collection details include fault severity levels and accelerometer data. The research aims to enhance gearbox fault diagnosis using advanced signal processing techniques.

Download Presentation

Please find below an Image/Link to download the presentation.
The content on the website is provided AS IS for your information and personal use only. It may not be sold, licensed, or shared on other websites without obtaining consent from the author.If you encounter any issues during the download, it is possible that the publisher has removed the file from their server.
You are allowed to download the files provided on this website for personal or commercial use, subject to the condition that they are used lawfully. All files are the property of their respective owners.
The content on the website is provided AS IS for your information and personal use only. It may not be sold, licensed, or shared on other websites without obtaining consent from the author.
E N D
Presentation Transcript
Vibration signal analysis to classify spur gearbox failure. Authors: Antonio P rez-Torres UPV Dr. Susana Barcel -Cerda UPV Dr. Ana Deb n UPV Dr. Rene-Vinicio S nchez UPS UPV - Universidad Polit cnica de Valencia - Espa a UPS - Universidad Polit cnica Salesiana - Ecuador
Introduction Gearboxes - Power transmission on shaft - High load capacity - Speed modification Detecting an early fault or malfunction is indispensable to avoid accidents, to plan maintenance and reduce downtime costs.
Objectives To determine a ranking of condition indicators to efficiently classify the severity level of a series of mechanical faults with vibration signals. To compare the classification methods: Random Forest and KNN.
Methodology Data extraction Feature extraction Feature selection Classification phase C.I. Selection Random Forest Time domain vibration signal Condition Indicators T.D. Severity Classification KNN / Random Forest Time domain vibration signal Condition Indicators T.D. D.B. matrix C.I. Time C.I. Selected Time Domain Gearbox Gearbox FFT Severity Classification KNN / Random Forest C.I. Selection Random Forest Condition Indicators F.D. D.B. matrix C.I. Frequency Frequency domain vibration signal Condition Indicators F.D. I.C. Selected Frequency Domain B.D. matrix I.C Time-Frequency I.C. Selected Time-Frequency
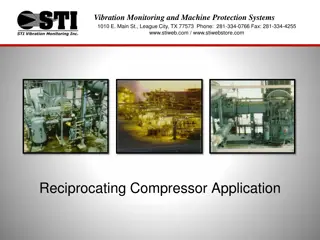
Testing bench A6 A4 A1 A4 A2 EL1 AE1 Mic2 Mic1 AE1 AE2 E1 EL1 Mic1 BREAK Sensor position (According to the geometric form) L2 L3 L1 Mic2 AE2 Vertical Horizontal CVC3 CVC2 CVC1 V3 Sensor type (According to the color) V2 A6 A5 V1 A3 Enconder Acoustic emission EL1 L1 L2 L3 N Laser enconder Microphone M A4 E1 Current clamp Voltage A1 A2 Accelerometer AE1 Mic1 SIMBOLOGY
Faults types Break Crack Pitting Scuffing Severity fault levels: 10 patterns per fault (P1 to P10)
Signal collection Fault severity spur gear combination for data Repetition Frequency R1 F1 (8Hz) R2 F2 (14Hz) R3 F3 (20Hz) R4 R5 R6 R7 R8 R9 R10 Channels Loads L1 (0V) L2 (10V) L3 (20V) Fault severity P1 P2 P3 P4 P5 P6 P7 P8 P9 P10 Accelerometers Length of each sample: 10 seconds. Accelerometers sampling frequency: (50kS/s)
Break feature selection RF Break ranking C.I. frequency domain Mean decrease accuracy Break ranking C.I. time domain Mean decrease accuracy CI selected FreqCP2 FreqShannonEnt FreqSkewness FreqCP5 FreqStd FreqVariance FreqCentral FreqCP4 FreqRMS FreqMean FreqCP1 FreqKurtosis Mean decrease Gini CI selected SigMean SigImpulseFactSD SigShapeFactor Sigsk SigKurt SigFastEnt SigMDR SigLatitudF SigCPT3 SigVerosneg Mean decrease Gini 0,231 0,186 0,182 0,187 0,186 0,171 0,176 0,132 0,118 0,154 0,115 0,122 58,63 55,06 50,98 50,83 50,62 48,80 46,52 45,90 42,76 42,41 37,07 34,73 0,168 0,143 0,124 0,080 0,083 0,065 0,051 0,059 0,077 0,052 55,33 34,71 31,56 27,97 24,95 21,83 17,15 17,03 16,96 16,53 Break ranking C.I. Time-Frequency domain CI Selected SigMean Mean decrease accuracy Mean decrease Gini 0,123 42,03 FreqCP2 0,130 26,29 SigImpulseFactSD 0,102 25,18 FreqShannonEnt 0,096 25,03 FreqStd 0,108 24,45 FreqSkewness FreqCP5 0,092 0,094 21,65 20,75 SigShapeFactor 0,067 20,09 FreqCentral 0,067 18,63 SigSk 0,047 17,87
Crack feature selection RF Crack ranking C.I. time domain Mean decrease accuracy Crack ranking C.I. frequency domain Mean decrease accuracy CI selected SigMean SigSk SigKurt SigFifthMoment SigImpulseFactSD SigShapeFactor SigLatitudF SigCrestFact SigFastEnt Sigmin Mean decrease Gini CI selected FreqShannonEnt FreqStd FreqSkewness FreqCP5 FreqCP1 FreqVariance FreqCP4 FreqCentral FreqCP2 FreqMean Mean decrease Gini 0,144 0,155 0,133 0,106 0,146 0,131 0,089 0,070 0,053 0,063 45,93 39,67 30,02 27,02 26,77 24,93 22,73 20,19 18,97 16,93 0,299 0,161 0,172 0,152 0,169 0,154 0,156 0,172 0,149 0,153 83,85 50,36 49,53 46,26 45,95 45,11 44,32 43,64 42,97 42,48 Crack ranking C.I. time-frequency domain Mean decrease accuracy FreqShannonEnt SigMean SigSk SigKurt FreqSkewness FreqCentral SigImpulseFactSD SigFifthMoment FreqKurtosis FreqStd CI selected Mean decrease Gini 0,181 0,108 0,111 0,088 0,070 0,080 0,096 0,064 0,084 0,054 42,23 36,75 31,10 20,05 19,34 19,17 18,19 17,43 17,35 17,01
Pitting feature selection RF Pitting ranking C.I. time domain Mean decrease accuracy Pitting ranking C.I. frequency domain Mean decrease accuracy CI selected SigMean SigSk SigImpulseFactSD SigShapeFactor SigKurt SigFifthMoment SigFastEnt SigImpulseFactor SigCrestFact SigLatitudF Mean decrease Gini CI selected FreqShannonEnt FreqSkewness FreqStd FreqKurtosis FreqCP5 FreqCP4 FreqCP2 FreqVariance FreqCP1 FreqRMS Mean decrease Gini 0,147 0,191 0,124 0,121 0,118 0,130 0,081 0,068 0,061 0,078 50,62 42,34 34,18 34,08 33,69 28,51 26,75 23,31 22,67 21,38 0,222 0,157 0,212 0,207 0,140 0,175 0,132 0,116 0,148 0,110 67,64 65,09 63,66 50,63 46,18 42,66 40,64 39,92 39,82 38,38 Pitting ranking C.I. time-frequency domain Mean decrease accuracy CI selected SigMean SigSk SigImpulseFactSD FreqStd SigShapeFactor FreqShannonEnt SigKurt SigFifthMoment SigCrestFact SigFastEnt Mean decrease Gini 0,125 0,152 0,096 0,095 0,084 0,073 0,070 0,107 0,053 0,060 42,90 33,11 27,98 26,93 24,59 22,12 21,87 21,09 19,86 19,68
Scuffing feature selection RF Scuffing ranking C.I. time domain Mean decrease accuracy Scuffing ranking C.I. frequency domain Mean decrease accuracy CI selected SigMean SigSk SigImpulseFactSD SigKurt SigFifthMoment SigShapeFactor Sigmin SigCrestFact SigClearanceFactor Sig6th Mean decrease Gini CI selected FreqCP4 FreqShannonEnt FreqStd FreqCP1 FreqMean FreqVariance FreqCP2 FreqCentral FreqKurtosis FreqCP5 Mean decrease Gini 0,167 0,134 0,129 0,094 0,099 0,097 0,079 0,057 0,067 0,070 57,74 33,05 29,17 27,40 26,73 25,71 21,60 20,18 18,03 17,98 0,252 0,192 0,154 0,179 0,162 0,168 0,165 0,208 0,162 0,130 53,48 52,17 51,80 51,23 50,93 50,58 47,81 46,97 44,01 40,49 Scuffing ranking C.I. time-frequency domain Mean decrease accuracy CI selected SigMean FreqShannonEnt FreqCentral SigImpulseFactSD FreqCP4 SigSk FreqStd SigKurt FreqCP1 SigShapeFactor Mean decrease Gini 0,106 0,114 0,126 0,084 0,121 0,076 0,057 0,056 0,079 0,066 41,09 25,91 22,68 20,91 20,49 19,54 18,80 18,37 18,29 17,73
Main conditions indicators Main C.I. time domain BREAK CRACK + + + + + + - - + Main C.I. frequency domain BREAK CRACK + + + + + + + + - + - + - Main C.I. time-frequency domain BREAK CRACK + sigImpulseFactSD freqShannonEnt freqStd sigSk sigShapeFactor freqCentral sigKurt freqSkewness sigFifthMoment freqCP2 freqCP5 freqKurtosis sigCrestFact sigFastEnt freqCP4 freqCP1 CI Selected SigMean SigImpulseFactSD SigShapeFactor SigSk SigKurt SigFastEnt SigFifthMoment SigCrestFact SigLatitudF SigMin SigMDR SigCPT3 SigVerosneg SigImpulseFactor SigLatitudF SigClearanceFactor Sig6th PITTING SCUFFING + + + + + - + + - + - - - - - + + CI Selected FreqCP2 FreqShannonEnt FreqCP5 FreqStd FreqVariance FreqCP4 FreqSkewness FreqCentral FreqCP1 FreqMean FreqKurtosis FreqRMS FreqRMS PITTING SCUFFING + + + + + + - + + + + - - CI Selected sigMean PITTING SCUFFING + + + + + + + + - - - - - - - + + + + + + + + + + + + - - - - - - - + + + + + + + + - - - - - + + - - + + + + + + + + + + - - - + + + + + + + - + - + - + + + + + + - + + + + - - + - - - - + + + + + + - + - + - - - + + - - + + + + + + - + - + + - - - - - + + + - - - -
Break Break Confusion matrix and statistics time domain KNN consfusion matrix time domain TestTarget 1 2 3 1 28 0 0 2 0 25 0 3 0 0 27 4 0 0 0 5 0 0 0 6 0 0 0 7 0 0 0 8 0 0 1 9 0 0 0 10 0 0 0 KNNpred 4 0 0 0 5 0 0 0 0 6 0 0 0 0 1 7 0 0 0 0 0 0 8 0 0 0 0 0 0 0 9 0 0 0 0 0 0 0 0 10 0 0 0 0 0 0 0 0 0 Overall Statistics Accuracy : 0.985 95% CI : (0.962, 0.996) p-value: < 2.2E-16 28 0 0 1 0 0 0 25 0 0 0 0 0 23 0 0 0 0 27 0 0 1 29 0 0 22 0 32 RF consfusion matrix time domain TestTarget 1 2 3 1 28 0 0 2 0 25 0 3 0 0 28 4 0 0 0 5 0 0 0 6 0 0 0 7 0 0 0 8 0 0 0 9 0 0 0 10 0 0 0 RFpred 4 0 0 0 5 0 0 0 0 6 0 0 0 0 0 7 0 0 0 0 0 0 8 0 0 0 0 0 0 0 9 0 0 0 0 0 0 0 0 10 0 0 0 0 0 0 0 0 0 Overall Statistics Accuracy : 1 95% CI : (0.986, 1) p-value: < 2.2e-16 29 0 0 0 0 0 0 25 0 0 0 0 0 24 0 0 0 0 28 0 0 0 29 0 0 22 0 32
Break Break Confusion matrix and statistics frequency domain KNN consfusion matrix frequency domain TestTarget 1 2 3 1 26 0 0 2 0 25 0 3 0 0 16 4 1 0 1 5 0 0 2 6 0 0 6 7 0 0 3 8 1 0 0 9 0 0 0 10 0 0 0 KNNPred 4 0 0 0 5 0 0 0 4 6 0 0 0 0 0 7 0 0 0 0 1 0 8 0 1 0 0 0 5 4 9 1 1 0 0 0 0 0 2 10 4 0 0 1 1 0 4 0 6 Overall Statistics Accuracy : 0.778 95% CI : (0.723, 0.826) p-value: < 2.2e-16 28 0 1 0 0 0 0 19 2 0 0 0 0 23 1 0 0 0 24 0 3 0 16 2 1 17 1 16 RF consfusion matrix frequency domain TestTarget 1 2 3 1 28 0 0 2 0 25 0 3 0 0 28 4 0 0 0 5 0 0 0 6 0 0 0 7 0 0 0 8 0 0 0 9 0 0 0 10 0 0 0 RFpred 4 0 0 0 5 0 0 0 0 6 0 0 0 0 0 7 0 0 0 0 0 0 8 0 0 0 0 0 0 0 9 0 0 0 0 0 0 0 0 10 0 0 0 0 0 0 0 0 0 Overall Statistics Accuracy : 0.997 95% CI : (0.980, 1) p-value: < 2.2e-16 29 0 0 0 0 0 0 25 0 0 0 0 0 23 1 0 0 0 28 0 0 0 29 0 0 22 0 32
Break Break Confusion matrix and statistics time-frequency domain KNN consfusion matrix time-frequency domain TestTarget 1 2 3 1 26 0 0 2 0 23 0 3 0 0 24 4 0 0 2 5 0 0 1 6 0 2 1 7 0 0 0 8 1 0 0 9 1 0 0 10 0 0 0 KNNPred 4 0 0 0 5 0 0 0 1 6 0 0 0 0 1 7 0 0 0 0 0 0 8 3 0 0 0 0 0 4 9 0 0 0 0 0 0 1 1 10 0 0 0 0 0 0 0 0 1 Overall Statistics Accuracy : 0.778 95% CI : (0.723, 0.826) p-value: < 2.2e-16 28 1 0 0 0 0 0 24 0 0 0 0 0 21 2 0 0 0 26 0 2 0 21 1 0 20 0 31 RF consfusion matrix time-frequency domain TestTarget 1 2 3 1 28 0 0 2 0 25 0 3 0 0 28 4 0 0 0 5 0 0 0 6 0 0 0 7 0 0 0 8 0 0 0 9 0 0 0 10 0 0 0 RFpred 4 0 0 0 5 0 0 0 0 6 0 0 0 0 0 7 0 0 0 0 0 0 8 0 0 0 0 0 0 0 9 0 0 0 0 0 0 0 0 10 0 0 0 0 0 0 0 0 0 Overall Statistics Accuracy : 0.997 95% CI : (0.980, 1) p-value: < 2.2e-16 29 0 0 0 0 0 0 25 0 0 0 0 0 24 0 0 0 0 28 0 0 0 28 0 1 22 0 32
Crack Crack Confusion matrix and statistics time domain KNN consfusion matrix frequency domain TestTarget 1 2 3 1 27 0 0 2 0 25 0 3 0 0 28 4 0 0 0 5 0 0 0 6 0 0 0 7 0 0 0 8 0 0 0 9 1 0 0 10 0 0 0 KNNPred 4 0 1 0 5 0 0 0 0 6 0 0 0 0 0 7 0 0 0 0 0 0 8 0 0 0 0 0 0 0 9 0 0 0 0 0 0 0 0 10 0 0 1 0 0 0 0 0 0 Overall Statistics Accuracy : 0.988 95% CI : (0.967, 0.998) p-value: < 2.2e-16 28 0 0 0 0 0 0 25 0 0 0 0 0 24 0 0 0 0 28 0 0 0 29 0 0 22 0 31 RF consfusion matrix frequency domain TestTarget 1 2 3 1 28 0 0 2 0 25 0 3 0 0 28 4 0 0 0 5 0 0 0 6 0 0 0 7 0 0 0 8 0 0 0 9 0 0 0 10 0 0 0 RFpred 4 0 0 0 5 0 0 0 0 6 0 0 0 0 0 7 0 0 0 0 0 0 8 0 0 0 0 0 0 0 9 0 0 0 0 0 0 0 0 10 0 0 0 0 0 0 0 0 0 Overall Statistics Accuracy : 0.990 95% CI : (0.968, 0.998) p-value: < 2.2e-16 26 0 0 0 0 3 0 25 0 0 0 0 0 24 0 0 0 0 28 0 0 0 29 0 0 22 0 32
Crack Crack Confusion matrix and statistics frequency domain KNN consfusion matrix frequency domain TestTarget 1 2 3 1 19 2 0 2 0 20 0 3 0 1 24 4 0 1 0 5 0 0 0 6 0 1 0 7 1 0 0 8 0 0 0 9 5 0 0 10 3 0 4 KNNPred 4 0 2 3 5 0 0 0 2 6 0 0 0 0 4 7 0 0 0 0 0 0 8 0 0 0 0 5 0 5 9 0 0 0 0 1 0 3 1 10 2 1 6 0 0 0 0 0 1 Overall Statistics Accuracy : 0.759 95% CI : (0.704, 0.809) p-value: < 2.2e-16 19 2 0 0 0 1 2 17 6 0 0 0 0 20 0 0 0 0 28 0 0 0 19 0 0 17 0 22 RF consfusion matrix frequency domain TestTarget 1 2 3 1 28 0 0 2 0 25 0 3 0 0 28 4 0 0 0 5 0 0 0 6 0 0 0 7 0 0 0 8 0 0 0 9 0 0 0 10 0 0 0 RFpred 4 0 0 0 5 0 0 0 0 6 0 0 0 0 0 7 0 0 0 0 0 0 8 0 0 0 0 0 0 0 9 0 0 0 0 2 0 0 0 10 0 0 0 0 0 0 0 0 0 Overall Statistics Accuracy : 0.993 95% CI : (0.974, 0.999) p-value: < 2.2e-16 29 0 0 0 0 0 0 25 0 0 0 0 0 24 0 0 0 0 28 0 0 0 29 0 0 20 0 32
Crack Crack Confusion matrix and statistics time-frequency domain KNN consfusion matrix time-frequency domain TestTarget 1 2 3 1 28 0 0 2 0 23 0 3 0 1 27 4 0 1 0 5 0 0 0 6 0 0 0 7 0 0 0 8 0 0 0 9 0 0 0 10 0 0 1 KNNPred 4 0 1 1 5 0 0 0 0 6 0 0 0 0 0 7 0 0 0 0 0 0 8 0 0 0 0 0 3 0 9 0 0 0 0 0 0 1 0 10 0 0 3 0 0 0 0 0 0 Overall Statistics Accuracy : 0.933 95% CI : (0.897, 0.960) p-value: < 2.2e-16 23 0 0 0 0 3 1 23 2 0 0 0 0 24 0 0 0 0 28 0 0 0 26 0 0 21 0 29 RF consfusion matrix time-frequency domain TestTarget 1 2 3 1 28 0 0 2 0 25 0 3 0 0 28 4 0 0 0 5 0 0 0 6 0 0 0 7 0 0 0 8 0 0 0 9 0 0 0 10 0 0 0 RFpred 4 0 0 0 5 0 0 0 0 6 0 0 0 0 0 7 0 0 0 0 0 0 8 0 0 0 0 0 0 0 9 0 0 0 0 0 0 0 0 10 0 0 0 0 0 0 0 0 0 Overall Statistics Accuracy : 1 95% CI : (0.986, 1) p-value: < 2.2e-16 29 0 0 0 0 0 0 25 0 0 0 0 0 24 0 0 0 0 28 0 0 0 29 0 0 22 0 32
Pitting Pitting Confusion matrix and statistics time domain KNN consfusion matrix time domain TestTarget 1 2 3 1 28 0 0 2 0 25 1 3 0 0 27 4 0 0 0 5 0 0 0 6 0 0 0 7 0 0 0 8 0 0 0 9 0 0 0 10 0 0 0 KNNPred 4 0 0 0 5 0 0 0 0 6 0 0 0 0 0 7 0 0 0 0 0 0 8 0 0 5 0 0 0 0 9 0 0 0 0 0 0 1 0 10 0 0 0 0 0 0 0 0 0 Overall Statistics Accuracy : 0.948 95% CI : (0.915, 0.971) p-value: < 2.2e-16 24 0 5 0 0 0 0 25 0 0 0 0 0 24 0 0 0 0 27 1 0 0 23 1 0 21 0 32 RF consfusion matrix time domain TestTarget 1 2 3 1 28 0 0 2 0 24 0 3 0 0 28 4 0 0 0 5 0 0 0 6 0 0 0 7 0 0 0 8 0 1 0 9 0 0 0 10 0 0 0 RFpred 4 0 0 0 5 0 0 0 0 6 0 0 0 0 0 7 0 0 0 0 0 0 8 0 0 0 0 0 0 0 9 0 0 0 0 0 0 0 0 10 0 0 0 0 0 0 0 0 0 Overall Statistics Accuracy : 0.9963 95% CI : (0.979, 1) p-value: < 2.2e-16 29 0 0 0 0 0 0 25 0 0 0 0 0 24 0 0 0 0 28 0 0 0 29 0 0 22 0 32
Pitting Pitting Confusion matrix and statistics frequency domain KNN consfusion matrix frequency domain TestTarget 1 2 3 1 26 0 0 2 0 24 0 3 0 0 13 4 0 0 3 5 0 0 10 6 1 0 1 7 0 0 0 8 0 0 1 9 0 0 0 10 1 1 0 KNNPred 4 3 2 2 5 0 0 4 0 6 0 0 3 3 1 7 0 0 0 0 0 0 8 0 0 0 0 0 0 0 9 0 0 0 0 0 0 0 7 10 0 1 2 1 6 0 0 0 0 Overall Statistics Accuracy : 0.722 95% CI : (0.665, 0.775) p-value: < 2.2e-16 16 0 4 0 1 0 1 20 0 0 0 0 1 17 0 0 0 0 19 2 7 0 23 6 0 15 0 22 RF consfusion matrix frequency domain TestTarget 1 2 3 1 28 0 0 2 0 25 0 3 0 0 25 4 0 0 0 5 0 0 3 6 0 0 0 7 0 0 0 8 0 0 0 9 0 0 0 10 0 0 0 RFpred 4 0 0 0 5 0 0 0 0 6 0 0 1 0 0 7 0 0 0 0 0 0 8 0 0 0 0 0 0 0 9 0 0 0 0 0 0 0 0 10 0 0 0 0 0 0 0 0 0 Overall Statistics Accuracy : 0.978 95% CI : (0.952, 0.992) p-value: < 2.2e-16 28 0 1 0 0 0 0 24 0 0 0 0 1 23 0 0 0 0 28 0 0 0 29 0 0 22 0 32
Pitting Pitting Confusion matrix and statistics time-frequency domain KNN consfusion matrix time-frequency domain TestTarget 1 2 3 1 28 0 0 2 0 24 0 3 0 0 22 4 0 1 2 5 0 0 3 6 0 0 0 7 0 0 0 8 0 0 1 9 0 0 0 10 0 0 0 KNNPred 4 0 3 1 5 0 0 0 0 6 0 0 2 2 0 7 0 0 0 0 0 0 8 0 0 0 0 0 0 0 9 0 0 0 0 0 0 2 4 10 0 0 0 0 0 0 0 0 0 Overall Statistics Accuracy : 0.867 95% CI : (0.820, 0.905) p-value: < 2.2e-16 24 0 1 0 0 0 0 25 0 0 0 0 0 20 0 0 0 0 21 0 7 0 22 7 0 16 0 32 RF consfusion matrix time-frequency domain TestTarget 1 2 3 1 28 0 0 2 0 25 0 3 0 0 28 4 0 0 0 5 0 0 0 6 0 0 0 7 0 0 0 8 0 0 0 9 0 0 0 10 0 0 0 RFpred 4 0 0 0 5 0 0 0 0 6 0 0 0 0 0 7 0 0 0 0 0 0 8 0 0 0 0 0 0 0 9 0 0 0 0 0 0 0 0 10 0 0 0 0 0 0 0 0 0 Overall Statistics Accuracy : 1 95% CI : (0.986, 1) p-value: < 2.2e-16 29 0 0 0 0 0 0 25 0 0 0 0 0 24 0 0 0 0 28 0 0 0 29 0 0 22 0 32
Scuffing Scuffing Confusion matrix and statistics time domain KNN consfusion matrix time domain TestTarget 1 2 3 1 28 0 0 2 0 25 0 3 0 0 28 4 0 0 0 5 0 0 0 6 0 0 0 7 0 0 0 8 0 0 0 9 0 0 0 10 0 0 0 KNNPred 4 0 0 0 5 0 0 0 1 6 0 0 0 0 1 7 0 0 0 0 0 0 8 0 0 0 0 0 0 0 9 0 0 0 0 0 0 0 0 10 0 0 0 0 0 0 0 0 0 Overall Statistics Accuracy : 0.985 95% CI : (0.963, 0.996) p-value: < 2.2e-16 29 0 0 0 0 0 0 24 0 0 0 0 0 23 0 0 0 0 26 0 0 2 29 0 0 22 0 32 RF consfusion matrix time domain TestTarget 1 2 3 1 28 0 0 2 0 25 0 3 0 0 28 4 0 0 0 5 0 0 0 6 0 0 0 7 0 0 0 8 0 0 0 9 0 0 0 10 0 0 0 RFpred 4 0 0 0 5 0 0 0 0 6 0 0 1 0 0 7 0 0 0 0 0 0 8 0 0 0 0 0 0 0 9 0 0 0 0 0 0 0 0 10 0 0 0 0 0 0 0 0 0 Overall Statistics Accuracy : 0.996 95% CI : (0.979, 1) p-value: < 2.2e-16 29 0 0 0 0 0 0 25 0 0 0 0 0 23 0 0 0 0 28 0 0 0 29 0 0 22 0 32
Scuffing Scuffing Confusion matrix and statistics frequency domain KNN consfusion matrix frequency domain TestTarget 1 2 3 1 20 0 0 2 0 25 0 3 0 0 22 4 2 0 0 5 1 0 0 6 0 0 0 7 0 0 4 8 3 0 0 9 2 0 0 10 0 0 2 KNNPred 4 3 0 0 5 0 0 0 5 6 0 0 0 1 4 7 0 0 2 0 1 0 8 0 0 0 0 0 0 1 9 0 0 0 0 0 0 1 3 10 1 0 3 0 0 2 0 0 2 Overall Statistics Accuracy : 0.730 95% CI : (0.673, 0.782) p-value: < 2.2e-16 15 1 2 3 1 3 1 15 2 2 0 1 0 17 0 1 1 0 20 2 0 3 21 5 2 18 0 24 RF consfusion matrix frequency domain TestTarget 1 2 3 1 28 0 0 2 0 25 0 3 0 0 28 4 0 0 0 5 0 0 0 6 0 0 0 7 0 0 0 8 0 0 0 9 0 0 0 10 0 0 0 RFpred 4 0 0 0 5 0 0 0 0 6 0 0 0 0 0 7 0 0 0 0 0 0 8 0 0 0 0 0 0 0 9 0 0 0 0 0 0 0 0 10 0 0 0 0 0 0 0 0 0 Overall Statistics Accuracy : 0.993 95% CI : (0.974, 0.999) p-value: < 2.2e-16 28 0 0 0 0 1 0 25 0 0 0 0 0 23 0 0 0 1 28 0 0 0 29 0 0 22 0 32
Pitting Pitting Confusion matrix and statistics time-frequency domain KNN consfusion matrix time-frequency domain TestTarget 1 2 3 1 22 0 0 2 0 25 0 3 0 0 26 4 1 0 0 5 0 0 0 6 0 0 0 7 0 0 1 8 0 0 0 9 5 0 0 10 0 0 1 KNNPred 4 1 0 0 5 0 0 0 3 6 0 0 0 1 2 7 0 0 2 0 3 0 8 0 0 0 0 0 0 0 9 0 0 0 0 0 1 1 1 10 0 0 0 0 0 0 2 2 0 Overall Statistics Accuracy : 0.837 95% CI : (0.788, 0.879) p-value: < 2.2e-16 20 0 3 1 2 2 0 19 1 2 0 0 0 19 0 2 0 0 23 0 0 0 25 4 0 19 0 28 RF consfusion matrix time-frequency domain TestTarget 1 2 3 1 28 0 0 2 0 25 0 3 0 0 28 4 0 0 0 5 0 0 0 6 0 0 0 7 0 0 0 8 0 0 0 9 0 0 0 10 0 0 0 RFpred 4 0 0 0 5 0 0 0 0 6 0 0 0 0 0 7 0 0 0 0 0 0 8 0 0 0 0 0 0 0 9 0 0 0 0 0 0 0 0 10 0 0 0 0 0 0 0 0 0 Overall Statistics Accuracy : 1 95% CI : (0.986, 1) p-value: < 2.2e-16 29 0 0 0 0 0 0 25 0 0 0 0 0 24 0 0 0 0 28 0 0 0 29 0 0 22 0 32
Conclusions The main conditions indicators per domain for all faults are: - Time domain: mean (T1), impulse factor sd, shape factor, sk, kurtuosis. - Frequency domain: CP2, Shannon entropy, CP5, std, variance, CP4. - Time-frequency domain: mean, impulse factor sd, freq Shannon entropy, Freq Std, sk. The best classification method is random forest for all domain and faults types.
Next works To determine whether the change in the position of a sensor influences the signal and depending on this the severity level of a fault can be classified. To classify the fault levels of a gearbox by reducing the dimensionality of the matrix of condition indicators using LCA and PCA. To use neural networks to classify the severity level of faults.
Bibliography Aldas Manzano, J., Uriel Jimenez, E.: An alisis multivariante aplicado con R. Ediciones Paraninfo, SA (2017) Alonso, N.F., Jos, R., Fern, P.F.: Determination of the bending strength geometry factor j for the calculation of stress in parallel-axis gears as a function of the reference correction and slope angle of the gear tooth. Int. J. Mech. Eng. Autom 3(1), 27 33 (2016) Cerrada, M., Zurita, G., Cabrera, D., S anchez, R.V., Art es, M., Li, C.: Fault diagnosis in spur gears based on genetic algorithm and random forest. Mechanical Systems and Signal Processing 70, 87 103 (2016) Cover, T., Hart, P.: Nearest neighbor pattern classification. IEEE transactions on information theory 13(1), 21 27 (1967) Duda, R.O., Hart, P.E., et al.: Pattern classification and scene analysis, vol. 3. Wiley New York (1973) Gharavian, M.H., Ganj, F.A., Ohadi, A., Bafroui, H.H.: Comparison of fda-based and pca-based features in fault diagnosis of automobile gearboxes. Neurocomputing 121, 150 159 (2013) Halim, E.B., Choudhury, M.S., Shah, S.L., Zuo, M.J.: Time domain averaging across all scales: A novel method for detection of gearbox faults. Mechanical Systems and Signal Processing 22(2), 261 278 (2008). Heyns, T., Godsill, S., De Villiers, J.P., Heyns, P.S.: Statistical gear health analysis which is robust to fluctuating loads and operating speeds. Mechanical Systems and Signal Processing 27, 651 666 (2012). Hong, H., Liang, M.: Separation of fault features from a single-channel mechanical signal mixture using wavelet decomposition. Mechanical Systems and Signal Processing 21(5), 2025 2040 (2007). Jafarizadeh, M., Hassannejad, R., Ettefagh, M., Chitsaz, S.: Asynchronous input gear damage diagnosis using time averaging and wavelet filtering. Mechanical Systems and Signal Processing 22(1), 172 201 (2008). Lei, Y., Zuo, M.J.: Gear crack level identification based on weighted k nearest neighbor classification algorithm. Mechanical Systems and Signal Processing 23(5), 1535 1547 (2009). Ninoslav, Z.F., Rusmir, B., Cvetkovic, D.: Vibration feature extraction methods for gear faults diagnosis-a review. Facta Universitatis, Series: Working and Living Environmental Protection 12(1), 63 72 (2015). Sanchez, R.V., Lucero, P., V asquez, R.E., Cerrada, M., Macancela, J.C., Cabrera, D.: Feature ranking for multi-fault diagnosis of rotating machinery by using random forest and knn. Journal of Intelligent & Fuzzy Systems 34(6), 3463 3473 (2018. Wang, D., Miao, Q., Zhou, Q., Zhou, G.: An intelligent prognostic system for gear performance degradation assessment and remaining useful life estimation. Journal of Vibration and Acoustics 137(2) (2015). Wang, D., Tsui, K.L., Miao, Q.: Prognostics and health management: A review of vibration based bearing and gear health indicators. Ieee Access 6, 665 676 (2017)


")