Viral Hepatitis Acute Infections: 2019 Summary and Insights
"Discover the 2019 data on acute viral hepatitis infections - including cases reported, estimated infections, and demographics for Hepatitis A, B, and C. Uncover key trends and affected groups in this comprehensive analysis."
Download Presentation

Please find below an Image/Link to download the presentation.
The content on the website is provided AS IS for your information and personal use only. It may not be sold, licensed, or shared on other websites without obtaining consent from the author. If you encounter any issues during the download, it is possible that the publisher has removed the file from their server.
You are allowed to download the files provided on this website for personal or commercial use, subject to the condition that they are used lawfully. All files are the property of their respective owners.
The content on the website is provided AS IS for your information and personal use only. It may not be sold, licensed, or shared on other websites without obtaining consent from the author.
E N D
Presentation Transcript
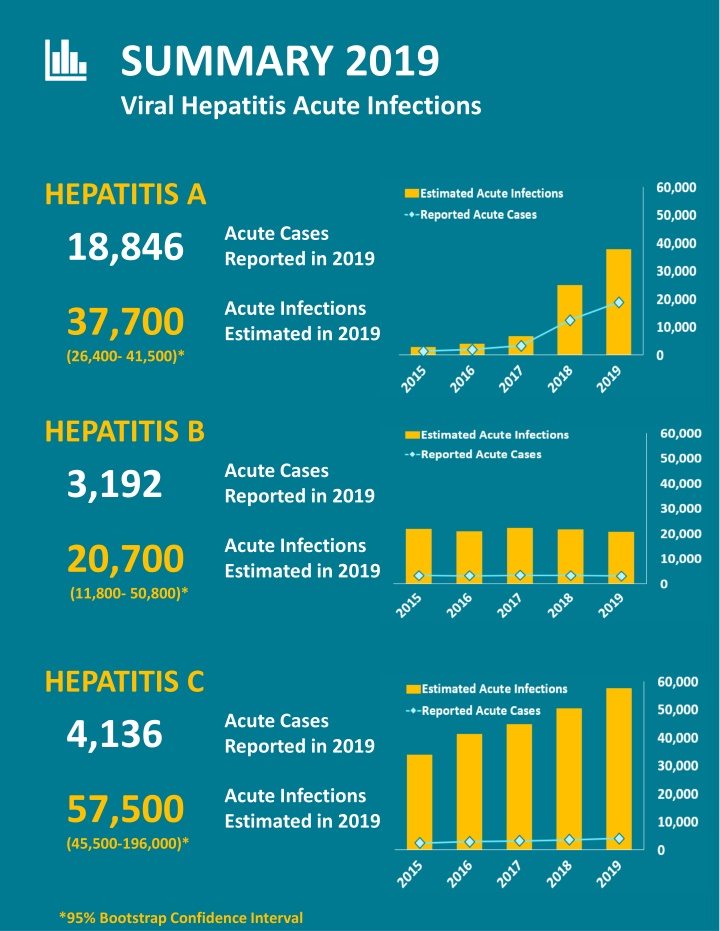
SUMMARY 2019 Viral Hepatitis Acute Infections HEPATITIS A 18,846 Acute Cases Reported in 2019 Acute Infections Estimated in 2019 37,700 (26,400- 41,500)* HEPATITIS B 3,192 Acute Cases Reported in 2019 Acute Infections Estimated in 2019 20,700 (11,800- 50,800)* HEPATITIS C 4,136 Acute Cases Reported in 2019 Acute Infections Estimated in 2019 57,500 (45,500-196,000)* *95% Bootstrap Confidence Interval
HEPATITIS A, 2019 Reported cases per 100,000 population 37,700* Acute infections estimated New cases reported 18,846 5.7 AT A GLANCE Hepatitis A in 2019 Hepatitis A incidence increased 1,325% from 2015 through 2019. The increase in 2019 was because of unprecedented person to person outbreaks in 31 states primarily among people who use drugs and people experiencing homelessness. GROUPS MOST AFFECTED BY HEPATITIS A IN 2019 By Age 20 29 years: 7.9 cases per 100,000 people 30 39 years: 14.5 cases per 100,000 people 40 49 years: 10.4 cases per 100,000 people By Sex Males: 7.3 cases per 100,000 people By Race/ Ethnicity White, Non-Hispanic: 6.8 cases per 100,000 people By Risk Injection Drug Use (IDU): Among the 10,991 reported cases with IDU information available, 5,017 (46%) reported IDU *95% Bootstrap Confidence Interval: (26,400 41,500) Indicates groups above the U. S. rate in 2019
ACUTE HEPATITIS B, 2019 Reported acute cases per 100,000 population Acute infections estimated 20,700* Acute cases reported 3,192 1.0 AT A GLANCE Acute Hepatitis B in 2019 Rates of acute hepatitis B remained low in children and adolescents, likely because of childhood vaccinations. However, more than half of acute hepatitis B cases reported to CDC in 2019 were among persons aged 30 49 years. GROUPS MOST AFFECTED BY ACUTE HEPATITIS B IN 2019 By Age 30 39 years: 1.8 cases per 100,000 people 40 49 years: 2.7 cases per 100,000 people 50 59 years: 1.6 cases per 100,000 people By Sex Males: 1.3 cases per 100,000 people By Race/Ethnicity White, Non-Hispanic: 1.0 cases per 100,000 people By Risk Injection Drug Use (IDU): Among the 1,780 reported cases with IDU information available, 631 (35%) reported IDU *95% Bootstrap Confidence Interval: (11,800 50,800) Indicates groups at or above the U.S. rate in 2019
ACUTE HEPATITIS C, 2019 Reported acute cases per 100,000 population Acute infections estimated 57,500* Acute cases reported 4,136 1.3 AT A GLANCE Acute Hepatitis C in 2019 Rates of acute hepatitis C increased again in 2019. The highest rates occurred in persons 20 39 years, consistent with age groups most impacted by the nation s opioid crisis. GROUPS MOST AFFECTED BY ACUTE HEPATITIS C IN 2019 By Age 20 29 years: 2.9 cases per 100,000 people 30 39 years: 3.2 cases per 100,000 people 40 49 years: 1.7 cases per 100,000 people By Sex Males: 1.6 cases per 100,000 people By Race/Ethnicity American Indian/Alaska Native: 3.6 cases per 100,000 people By Risk Injection Drug Use (IDU): Among the 1,952 reported cases with IDU information available, 1,302 (67%) reported IDU *95% Bootstrap Confidence Interval: (45,500 196,000) Indicates groups above the U.S. rate in 2019

