Virginia Economic Outlook 2020-2022 and Revenue Forecast Presentation
Explore the fiscal year 2020 review of general fund revenues and the Virginia economy, with an interim economic outlook and revenue forecast for fiscal years 2021 and 2022. Key topics covered include economic performance, revenue collections, financial results, and future outlook based on national and state economic indicators.
Download Presentation

Please find below an Image/Link to download the presentation.
The content on the website is provided AS IS for your information and personal use only. It may not be sold, licensed, or shared on other websites without obtaining consent from the author. If you encounter any issues during the download, it is possible that the publisher has removed the file from their server.
You are allowed to download the files provided on this website for personal or commercial use, subject to the condition that they are used lawfully. All files are the property of their respective owners.
The content on the website is provided AS IS for your information and personal use only. It may not be sold, licensed, or shared on other websites without obtaining consent from the author.
E N D
Presentation Transcript
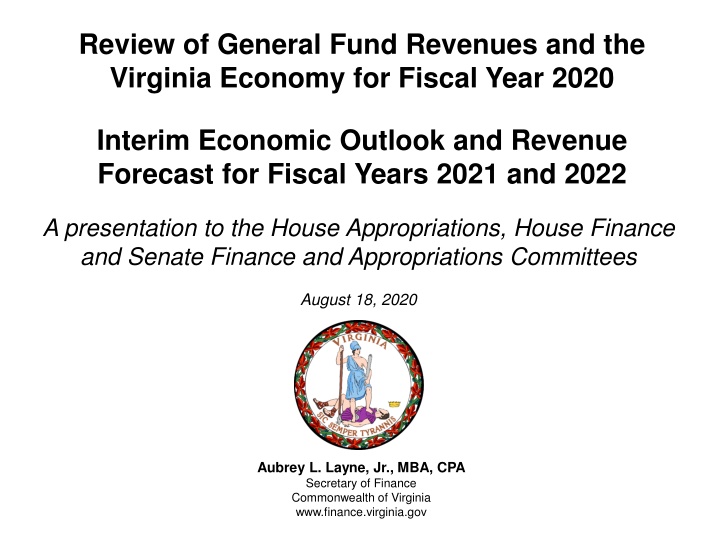
Review of General Fund Revenues and the Virginia Economy for Fiscal Year 2020 Interim Economic Outlook and Revenue Forecast for Fiscal Years 2021 and 2022 A presentation to the House Appropriations, House Finance and Senate Finance and Appropriations Committees August 18, 2020 Aubrey L. Layne, Jr., MBA, CPA Secretary of Finance Commonwealth of Virginia www.finance.virginia.gov
Overview Fiscal Year 2020 Year-in-Review Economic Performance Certified General Fund Collections Certified Commonwealth Transportation Fund Collections Financial Results Balance Sheet Updated Outlook for Fiscal Years 2021 and 2022 June 2020 Economic Outlook August 2020 Interim Revenue Forecast Revenue Stabilization and Revenue Reserve Fund Balances Looking Forward National and State Economic Indicators July 2020 General Fund Collections Fall Forecasting Process Known Funding Commitments / Risks CARES Funding Update Base Budget 1
In FY 2020, Both the U.S. and Virginia Economies Were Growing On Par With the Official Forecast Through February; However, Employment Started to Decline in March as the COVID-19 Pandemic Arrived Summary of Key U.S. and Virginia Economic Indicators Percent Change Over the Prior Fiscal Year FY19 Actual FY20 Forecast FY20 Actual U.S. Real GDP Consumer Spending Employment Personal Income Wages & Salaries 2.6 2.8 1.5 5.0 4.8 1.9 2.8 1.2 4.5 5.2 -2.1 -2.5 -2.0 3.9 0.9 Virginia Employment Professional/Business Construction/Mining Education/Health Government Personal Income Wages & Salaries 1.2 1.7 1.9 3.0 0.7 4.8 4.3 1.0 2.3 -0.1 2.7 0.2 4.4 4.2 -1.7 -0.5 -1.7 1.0 -0.8 3.7 0.9 2
Including Transfers, FY 2020 General Fund Resources Grew 2.2 Percent and Finished $232.0 Million (1.0 Percent) Below Forecast Summary of Fiscal Year 2020 Revenue Collections (millions of dollars) As a % of Total General Fund 59.6% 0.0 17.0 (8.2) 0.0 68.4% % Growth Over FY19 Official Major Sources Withholding Nonwithholding Refunds Net Individual Official $13,591.9 3,804.1 (1,976.6) $15,419.4 Actual Change ($213.8) 0.4 145.7 ($67.8) Actual $13,378.1 3,804.5 (1,830.9) $15,351.6 4.7 % (4.3) 13.7 1.3 % 3.0 (4.3) 5.3 0.8 % 0.0 Sales Corporate Wills (Recordation) Insurance All Other Revenue 16.5% 0.0 4.5 0.0 2.2 0.0 1.6 0.0 3.7 $3,844.5 1,031.5 468.6 394.1 813.9 $3,706.8 1,011.7 483.5 360.6 823.6 ($137.7) (19.9) 14.9 (33.5) 9.7 7.4 % 9.3 21.3 3.2 3.2 3.5 % 7.2 25.1 (5.6) 14.6 96.9% 2.0 % Total Revenue $21,972.0 $21,737.8 ($234.2) 3.1 % A.B.C. Profits Sales Tax (0.375%) Transfers 0.6 1.8 1.8 0.0 0.7 $124.8 421.6 155.3 $137.5 406.0 406.0 160.4 $12.7 (15.6) 5.1 (4.5) % 7.4 15.3 5.2 % 3.4 19.1 3.1% Total Transfers $701.7 $703.9 $2.2 6.6 % 7.0 % 100.0% TOTAL GENERAL FUND $22,673.7 $22,441.7 ($232.0) 3.2 % 2.2 % Payroll withholding and sales tax collections slowed in the final quarter of fiscal year 2020. 3
Growth in Total General Fund Revenue Collections FY20 Monthly and Year-to-Date 32% 28% 24% Forecast: 3.1% 20% 16.0% 16% 7.3% 8.5% 8.2% 12% 8.5% 8.4% 8.3% 6.2% 8% 1.4% -1.2% 4% 6.6% 0% 2.0% -4% -8% -12% Monthly Year-to-Date -16% -20% -24% -28% -32% Jul Aug Sep Oct Nov Dec Jan Feb Mar Apr May Jun Monthly Growth: 16.0% 0.3% 9.3% 9.6% 8.4% 7.6% 8.7% -12.4% 10.8% -26.2% -20.6% 26.8% Total general fund revenues increased 26.8 percent in June. This was expected as the May 1 due date for individual and corporate income tax payments was deferred to June 1. On a year-to-date basis, total revenues increased 2.0 percent, behind the annual forecast of a 3.1 percent increase. 4
Growth in Withholding Tax Collections FY20 Monthly and Year-to-Date 22% 19.3% 20% 18% 16% 14% Forecast: 4.7% 12% 10% 7.0% 5.8% 8% 5.7% 5.5% 5.8% 5.7% 4.8% 4.7% 5.1% 6% 3.1% 4% 2% 0% 3.0% -2% -4% -6% -8% -10% -12% Monthly Year-to-Date -14% -16% Jul 19.3% -3.2% 3.4% 5.5% 2.5% 9.2% 5.2% 3.7% -0.4% 4.2% -13.0% 2.3% Aug Sep Oct Nov Dec Jan Feb Mar Apr May Jun Monthly Growth: Collections increased 2.3 percent in June. Year-to-date, withholding collections have increased 3.0 percent compared with the same period last year, behind the projected annual growth of 4.7 percent. 5
Slowdown in Withholding Was Broad-based and Included a Large Decline in the Final Quarter Withholding Tax Collections April June Fiscal Years 2018 - 2020 millions of dollars # of Firms in FY16 100 300 244 719 170 224 232 59 188 681 Millions of Dollars Percent Change Industry (% of Total $ Amount) Public Sector (18%) Education and Health Services (8%) Federal Contractors (3%) Professional and Business Services (3%) Finance (3%) Investment (2%) Manufacturing (1%) Transportation (1%) Housing (1%) Other (4%) FY18 $532.0 $257.2 $118.7 $85.2 $86.7 $64.4 $44.0 $33.8 $26.7 $123.8 FY19 $565.9 $271.1 $119.0 $109.4 $95.1 $71.5 $44.3 $31.5 $30.3 $132.4 FY20 $574.6 $263.4 $112.7 $109.3 $105.3 $68.5 $41.7 $31.2 $26.9 $130.5 FY18 5.6% 4.8% 6.7% -1.3% 5.4% 14.2% 20.2% 4.5% 3.0% 7.4% FY19 6.4% 5.4% 0.2% 28.4% 9.7% 11.0% 0.6% -6.7% 13.3% 7.0% FY20 1.5% -2.8% -5.3% -0.1% 10.7% -4.2% -5.8% -1.1% -11.4% -1.5% Total Large Payers (45%) Total Small Payers (55%) Total All 2,917 221,588 224,505 $1,372.6 $1,811.9 $3,184.5 $1,470.5 $1,855.9 $3,326.4 $1,464.0 $1,791.9 $3,255.9 5.9% 11.5% 9.0% 7.1% 2.4% 4.5% -0.4% -3.4% -2.1% Note: Companies making payments in excess of $100,000. 6
Payroll Withholding by Month Tracking Payroll Withholding Payment by Payment Size Percent Change $0 to $5k $5 to $10k $10 to $100k Over $100k Total 17% of total 6% of total 25% of total 52% of total Number Amount Number Amount Number Amount Number Amount Number Amount March April May June July 0.3 2.2 10.2 6.1 8.6 1.7 0.9 15.8 3.9 10.8 1.8 5.5 18.7 6.3 15.1 1.8 7.2 18.7 6.8 15.2 2.8 6.3 17.2 3.4 13.7 2.0 7.5 15.2 3.5 13.8 4.3 1.4 10.3 5.2 14.0 0.9 6.6 6.4 4.5 7.2 0.5 1.5 10.9 6.0 10.7 1.4 5.8 11.5 0.3 5.6 April - May June - July 6.0 1.7 7.4 3.6 7.1 5.0 6.4 4.8 6.1 5.5 4.5 5.5 5.1 4.8 1.6 0.8 6.0 2.0 3.8 2.1 Typical Dealer Distribution Number /Amount 91% 225k 4% 9.7k 4% 10.7k 1% 1.3k 100% 249k $190m $68m $285m $585m $1.1b Dealers with $5k monthly withholding equate to about an annual payroll of $1.5 million, $10k = $3 million, $100k = $30 million Payroll withholding by firm size has shown small businesses have been disproportionally affected by COVID-19. 7
Growth in Sales Tax Collections FY20 Monthly and Year-to-Date 15% Forecast: 7.4% 8.8% 8.0% 8.5% 8.4% 10% 8.1% 8.4% 7.4% 7.8% 7.0% 3.5% 5% 5.4% 0% -3.8% -5% -10% Monthly Year-to-Date -15% Jul Aug Sep Oct Nov Dec Jan Feb Mar Apr May Jun Monthly Growth: -3.8% 12.9% 9.0% 8.4% 11.9% 5.1% 9.9% 8.8% 7.9% -0.4% -12.5% -7.8% Collections of sales and use taxes, reflecting mainly May sales, decreased 7.8 percent in June. For FY20, collections increased 3.5 percent ($125.6 million), behind the annual estimate of 7.4 percent growth. Retail sales collections fell 4.5 percent and use tax collections increased 32.3 percent. 90 percent of the increase in use tax collections were from new Wayfair related dealers. 8
Use Tax Payments Surged, While Sales Tax Payments for Several Industries Declined During the Shutdown Sale and Use Tax Collections Fiscal Years 2018 - 2020 millions of dollars # of Firms in FY17 208 6 29 162 135 111 97 25 143 499 Millions of Dollars Percent Change Industry (% of Total $ Amount) Housing (16%) Warehouse Clubs/Supercenters (14%) Grocery Stores (10%) Retail Trade (9%) Department Stores (7%) Restaurants (4%) Wholesale Trade (3%) Gasoline Stores (2%) Manufacturing (1%) Other (5%) FY18 $576.4 $459.0 $348.5 $353.7 $350.8 $162.3 $92.3 $51.4 $41.9 $232.6 FY19 $603.3 $523.3 $356.6 $357.9 $336.4 $169.5 $90.2 $54.2 $42.8 $227.7 FY20 $610.4 $511.6 $383.2 $337.9 $262.2 $157.2 $94.7 $64.2 $46.5 $195.1 FY18 -0.2% -3.2% -2.9% 1.0% -2.7% -4.3% 7.0% -1.9% 9.6% 9.4% FY19 FY20 4.7% 14.0% 2.3% 1.2% -4.1% 4.4% -2.2% 5.5% 2.0% -2.1% 1.2% -2.2% 7.4% -5.6% -22.1% -7.2% 5.0% 18.3% 8.8% -14.3% Total Sales Large Payers Total Use Large Payers 1,415 196 $2,669.0 $2,762.0 $2,663.1 $556.6 $653.5 $1,029.2 -0.4% 12.4% 3.5% 17.4% -3.6% 57.5% Note: Dealers making payments in excess of $100,000. 9
Nonwithholding Tax Collections FY18 FY20 Monthly 1,400 FY18 FY19 FY20 1,200 1,000 * Millions 800 * 600 * 400 200 0 Jul Aug Sep Oct Nov Dec Jan Feb Mar Apr May Jun June receipts were up significantly as the May 1 filing date for final tax year 2019 and the first estimated payment for tax year 2020 was moved to June 1. There is no equivalent historical data to compare this year to past years. 10
Nonwithholding Tax Collections Large Individual Payments September April - May Number of Payments 149 Total Amount of Payments M$ $37.7 Number of Payments 930 Total Amount of Payments M$ $330.8 FY07 162 $38.1 924 $344.2 FY08 144 $37.6 511 $257.9 FY09 81 $19.0 328 $112.5 FY10 79 $18.6 547 $204.7 FY11 119 115 118 139 171 159 165 212 237 $48.9 $41.5 $34.9 $40.0 $50.1 $54.0 $52.5 $62.4 $79.3 521 884 427 606 687 645 646 1,195 1,325 $184.4 $327.5 $141.5 $215.5 $220.2 $178.7 $201.8 $463.8 $512.0 FY12 FY13 FY14 FY15 FY16 FY17 FY18 FY19 FY20 FY20 includes the estimated and final payments received in June that were originally due May 1. 11
Corporate Income Tax Receipts Fell Short of the Annual Estimate By $19.9 Million (1.9 Percent) In Fiscal Year 2020 Growth in Net Corporate Income Tax Receipts, FY87-20 Percent Growth Over the Prior Year 50% 40% 30% 20% 10% 0% -10% -20% -30% -40% 87 88 89 90 91 92 93 94 95 96 97 98 99 00 01 02 03 04 05 06 07 08 09 10 11 12 13 14 15 16 17 18 19 20 Corporate income tax collections, 5 percent of total revenues and one of the most volatile sources, grew 7.2 percent in FY20, behind the annual estimate of a 9.3 percent increase. 12
By the End of FY 2021, the Combined Balances of the Revenue Stabilization Fund and the Revenue Reserve Will Exceed $1.1 Billion Preliminary Balance Sheet - June 30, 2020 General Fund - Cash Basis (Unaudited) (Dollars in Thousands) Assets Cash, Cash Equivalents, and Investments Cash and Travel Advances Other Assets Due From Other Funds $ 3,653,405 494 367 125 Total Assets $ 3,654,391 Liabilities and Fund Equity Liabilities: Payments Awaiting Disbursement Deposits Pending Distribution Due To Other Funds 122,724 5,953 1,115 Total Liabilities $ 129,792 Fund Equity: Restricted Fund Balance: Revenue Stabilization Fund Revenue Stabilization Reserve 2021 Lottery Proceeds Fund Water Supply Assistance Grant Fund 558,432 77,410 12,930 1,768 Total Restricted Fund Balance 650,540 Committed Fund Balance: Amount Required for Reappropriation of 2020 Unexpended Balances for Capital Outlay and Restoration Projects Virginia Health Care Fund Central Capital Planning Fund Communication Sales and Use Tax Commonwealth's Development Opportunity Fund Natural Disaster Sum Sufficient Amount Required for Mandatory Reappropriation Virginia Water Quality Improvement Fund Virginia Water Quality Improvement Fund - Part A 2019 Virginia Water Quality Improvement Fund - Part B 2019 Virginia Water Quality Improvement Fund - Part B 2020 Revenue Reserve Fund Taxpayer Relief Fund COVID-19 General Fund Local Government Fiscal Distress Amount Required by Chapter 1289 Amount Required for Discretionary Reappropriations Other Nongeneral Fund Balances Reported in the General Fund 7,839 44,891 5,421 32,886 40,310 54,754 298,025 64,978 32,386 14,640 30,350 513,245 175 3,307 750 1,185,284 273,146 271,672 2,874,059 Total Commitments and Assignments Total Unassigned Fund Balance - Total Fund Equity $ 3,524,599 Total Liabilities and Fund Balance $ 3,654,391 13
As a Result of the FY20 Revenue Shortfall, Governor Northam Ordered the Secretary of Finance to Conduct a Reforecast of Revenues The July 2020 interim revenue forecast is based on the updated economic outlook for Virginia as approved by the Joint Advisory Board of Economists (JABE) and the Governor s Advisory Council on Revenue Estimates (GACRE) . IHS Markit s June 2020 standard and pessimistic forecasts for the U.S. and the associated outlook for Virginia were presented to the JABE and GACRE. At the JABE meeting with 12 members participating, 5 members supported the standard outlook, 5 members supported a standard minus outlook for fiscal year 2021 combined with the standard outlook for fiscal year 2022, and 2 supported the pessimistic outlook for both years of the biennium. At the GACRE meeting of business leaders, with 15 members participating, 7 members supported the standard outlook, 8 members supported a standard minus outlook for fiscal year 2021 combined with the standard outlook for fiscal year 2022. The Governor decided to recommend using the standard forecast for both years at this time given the recent strength in revenue collections, and to reevaluate the forecast during the normal fall forecasting season. 14
Key U.S. and Virginia Economic Indicators June Standard Forecast (annual percent change) Fiscal Year 18 2.8 2.8 2.3 1.4 17 2.0 19 2.6 2.8 2.1 2.3 20 (2.1) (4.0) 6.7 (2.5) (3.7) 5.5 1.6 0.8 1.2 0.1 21 22 Real GDP Consumer Spending 2.6 CPI 3-Month T-bill 1.9 0.6 2.3 0.1 Employment U.S. Virginia 1.7 1.0 1.5 1.2 1.5 1.2 (2.0) (3.0) 5.3 (1.7) (2.0) 1.2 Personal Income U.S. Virginia 3.5 2.7 5.4 4.6 5.0 4.8 3.9 3.7 0.3 2.8 3.8 2.5 Wages & Salaries U.S. Virginia 3.6 3.3 5.3 4.3 4.8 4.3 0.9 0.9 0.5 1.9 7.9 4.5 15
Official and Interim Standard General Fund Forecasts (Dollars in Millions) 8/18/2020 Fiscal Year 2021 % Growth Over FY21 Official Official Interim Change Interim 0.0 0.0 Withholding Nonwithholding Refunds Net Individual $14,118.0 4,101.0 (2,059.9) $16,159.1 $13,704.2 3,668.9 (1,924.9) $15,448.2 ($413.8) (432.1) 135.0 ($710.9) 3.9 7.8 4.2 4.8 % 2.4 (3.6) 5.1 0.6 % Sales Corporate Wills (Recordation) Insurance All Other Revenue $3,893.0 1,019.2 388.1 420.1 808.3 $3,346.5 1,041.7 422.4 337.4 756.9 ($546.5) 22.5 34.3 (82.7) (51.4) 1.3 (1.2) (17.2) 6.6 (0.7) (9.7) 3.0 (12.6) (6.4) (8.1) Total Revenue $22,687.8 $21,353.1 ($1,334.7) 3.3 % (1.8) % A.B.C. Profits Sales Tax (0.375%) Transfers Per Act $125.1 426.9 103.8 $125.1 365.7 103.8 $0.0 (61.2) 0.0 0.2 1.3 (33.2) % (9.0) (9.9) (35.3) % Total Transfers $655.8 $594.6 ($61.2) (6.5) % (15.5) % TOTAL GENERAL FUND $ $23,343.6 $ $21,947.7 $ (1,395.9) 3.0 % (2.2) % 16
Interim Standard General Fund Forecast (Dollars in Millions) August 18, 2020 Fiscal Year 2022 2020-2022 Biennium % Growth Over FY21 Official $14,676.4 4,306.5 (2,137.4) $16,845.5 Interim $14,341.0 3,784.9 (2,062.4) $16,063.5 Change ($335.4) (521.6) 75.0 ($782.0) Official Interim Official $28,794.4 8,407.5 (4,197.3) $33,004.6 Interim $28,045.2 7,453.8 (3,987.3) $31,511.7 Change ($749.2) (953.7) 210.0 ($1,492.9) Withholding Nonwithholding Refunds Net Individual 4.0 5.0 3.8 4.2 % 4.6 3.2 7.1 4.0 % Sales Corporate Wills (Recordation) Insurance All Other Revenue $3,955.6 1,132.6 357.0 437.1 810.5 $3,438.7 1,143.0 393.0 359.5 787.8 ($516.9) 10.4 36.0 (77.6) (22.7) 1.6 11.1 (8.0) 4.0 0.3 2.8 9.7 (7.0) 6.6 4.1 $7,848.6 2,151.8 745.1 857.2 1,618.8 $6,785.2 2,184.7 815.4 696.9 1,544.7 ($1,063.4) 32.9 70.3 (160.3) (74.1) Total Revenue $23,538.3 $22,185.5 ($1,352.8) 3.7 % 3.9 % $46,226.1 $43,538.6 ($2,687.5) A.B.C. Profits Sales Tax (0.375%) Transfers Per Act $128.7 433.7 103.8 $128.7 375.9 103.8 $0.0 (57.8) 0.0 2.9 1.6 0.0 % 2.9 2.8 0.0 % $253.8 860.6 207.6 $253.8 741.6 207.6 $0.0 (119.0) 0.0 Total Transfers $666.2 $608.4 ($57.8) 1.6 % 2.3 % $1,322.0 $1,203.0 ($119.0) TOTAL GENERAL FUND $24,204.5 $22,793.9 ($1,410.6) 3.7 % 3.9 % $47,548.1 $44,741.6 ($2,806.5) 17
FY 2020 Commonwealth Transportation Fund (CTF) Collections Were $121.0 Million Short of Forecast Actual Collections Compared to the Official Forecast for Fiscal Year 2020 (Millions of Dollars) Percent Change 2019-2020 Actual FY2019 Actual FY2020 Actual FY2020 Forecast Forecast Variance Amount Revenue Sources Forecast Percent Motor Fuels Tax 844.7 843.3 884.9 (0.2) 4.8 (41.6) (4.7) Road Use Tax 9.8 21.2 24.8 116.3 153.1 (3.6) (14.5) Vehicle Sales Tax 978.6 954.5 988.8 (2.5) 1.0 (34.3) (3.5) Vehicle Licenses 266.1 272.2 299.2 2.3 12.4 (27.0) (9.0) State Sales Tax 1,087.8 1,123.4 1,153.1 3.3 6.0 (29.7) (2.6) Recordation Tax 47.1 59.7 48.8 26.8 3.6 10.9 22.3 Insurance Premiums Tax 168.7 183.6 183.6 8.8 8.8 0.0 0.0 Int'l Registration Plan 72.6 70.4 70.8 (3.0) (2.5) (0.4) (0.6) Interest Earnings 16.4 19.3 9.8 17.7 (40.2) 9.5 96.9 Rental Tax 42.4 38.8 43.6 (8.5) 2.8 (4.8) (11.0) Aviation Fuels Tax 2.0 1.8 2.0 (10.0) 0.0 (0.2) (10.0) Miscellaneous 19.0 18.1 17.9 (4.7) (5.8) 0.2 1.1 TOTAL $3,555.2 $3,606.3 $3,727.3 1.4 4.8 (121.0) (3.2) Total revenue growth lagged the target with a 3.2 percent forecast variance. The forecast variance can be attributed to the pandemic s effects on motor fuels and motor vehicle sales tax collections. 18
Official and Interim Standard Commonwealth Transportation Fund Forecasts Fiscal Year 2021 Growth over FY20 Official Interim Change Official Interim Motor Fuels Taxes (1) Priority Transportation Fund (2) Motor Vehicles Sales Tax (3) Retail Sales Tax Motor Vehicle License Fees All Other Revenue $ 1,124.6 197.6 1,038.9 1,183.0 223.5 186.9 $ 1,010.4 181.4 929.9 1,021.6 223.5 186.9 $ (114.2) (16.2) (109.0) (161.4) 0.0 0.0 29.8 % 7.6 4.6 5.2 -17.5 11.4 16.6 % -1.2 -6.3 -9.1 -17.5 11.4 Total (4) $ 3,954.5 $ 3,553.7 $ (400.8) 9.7 % -1.4 % Fiscal Year 2022 Growth over FY21 Official Interim Change Official Interim Motor Fuels Taxes (1) Priority Transportation Fund (2) Motor Vehicles Sales Tax (3) Retail Sales Tax Motor Vehicle License Fees All Other Revenue $ 1,371.5 205.9 1,062.1 1,202.1 224.9 197.0 $ 1,255.6 205.9 981.0 1,050.2 224.9 197.0 $ (115.9) 0.0 (81.1) (151.9) 0.0 0.0 22.0 % 4.2 2.2 1.6 0.6 5.4 24.3 % 13.5 5.5 2.8 0.6 5.4 Total (4) $ 4,263.5 $ 3,914.6 $ (348.9) 7.8 % 10.2 % Notes: (1) Includes aviation and road tax (2) Insurance premiums tax (3) Includes rental tax (4) Total state taxes and fees. 19
National and State Economic Indicators According to the advance estimate, real GDP fell at an annualized rate of 32.9 percent in the second quarter of 2020. Payroll employment rose by 1.8 million jobs in July. The leisure and hospitality and retail trade sectors accounted for most of the gain, reflecting the reopening of the economy. Employment has increased by 9.2 million during the past 3 months but is still 12.9 million below February levels. The national unemployment rate fell from 11.1 to 10.2 percent in July. Since the peak of employment in February, employment is still down 12.9 million jobs. Initial claims for unemployment fell by 249,000 to 1.2 million during the week ending August 1, consistent with an improving labor market. The Conference Board s index of leading indicators rose 2.0 percent in June. The Conference Board s index of consumer confidence fell from 98.1 to 92.6 in July. The expectations component drove the decline. The Institute of Supply Management index rose from 52.6 to 54.2, the second consecutive month above the neutral threshold of 50.0. 20
National and State Economic Indicators The CPI rose 0.6 percent in June following three months of declines, and stands 0.7 percent above June 2019. Core inflation (excluding food and energy prices) rose by 0.2 percent, and has increased 1.2 percent from last year. At its July meeting, the Federal Reserve left the federal funds target rate unchanged at the range of 0.0 to 0.25 percent. In Virginia, payroll employment fell 7.6 percent in June compared with last year. Northern Virginia posted a decline of 7.6 percent; Hampton Roads employment fell 7.6 percent, and Richmond-Petersburg fell 7.9 percent. The seasonally adjusted unemployment rate fell 0.4 percentage point to 8.5 percent in June compared with 2.9 percent in June of last year. Since the peak of employment in February, employment is still down 349,400 jobs. The Virginia Leading Index rose by 0.8 percent in June after falling 2.0 percent in May. Auto registrations declined in June while the U.S. Leading index, future employment, and initial claims for unemployment improved. The indexes for Northern Virginia and Harrisonburg were unchanged. The index for Winchester decreased in June while the indexes for the remaining eight regions increased. 21
Julys Revenue Collections Increased 24.1 Percent FY 2021 Estimate Per Chapter 1289 Commonwealth of Virginia/Department of Accounts Summary Report on General Fund Revenue Collections For the Fiscal Years 2020 and 2021 (Dollars in Thousands) (1) (2) (3) (4) (5) (6) (7) (8) (9) % Annual Growth Req By Est July Year-To-Date FY 2021 Estimate As a % of Gen Fund Rev % % Revenue FY 2021 FY 2020 Change FY 2021 FY 2020 Change Individual Income Tax: Withholding Tax Dues/Estimated Payments $14,118,000 4,101,000 62.22 18.08 $1,064,844 391,293 $1,063,356 67,956 0.1 $1,064,844 391,293 $1,063,356 67,956 0.1 5.5 7.8 475.8 475.8 $18,219,000 80.30 $1,456,137 $1,131,312 28.7 $1,456,137 $1,131,312 28.7 6.0 Gross Individual Income Tax Individual and Fiduciary Income (Refunds) Net Individual Income Tax (2,059,900) (9.08) (157,854) (48,362) 226.4 (157,854) (48,362) 226.4 12.5 $16,159,100 71.22 $1,298,283 $1,082,950 19.9 $1,298,283 $1,082,950 19.9 5.3 $3,893,000 17.16 $209,320 $144,849 44.5 $209,320 $144,849 44.5 5.0 Sales and Use Tax Corporations Income Tax Wills, Suits, Deeds, Contracts Insurance Premiums Interest Income (a) Alcoholic Beverage Sales (b) All Other Revenues Total General Fund Revenues 1,019,200 4.49 79,242 36,629 116.3 79,242 36,629 116.3 0.7 388,100 420,100 1.71 1.85 54,814 43,968 24.7 - 54,814 43,968 24.7 - (19.7) 16.5 0 0 0 0 111,400 260,400 436,500 0.49 1.15 1.93 17,182 4,251 28,596 24,321 3,665 26,617 (29.4) 16.0 7.4 24.1 17,182 4,251 28,596 24,321 3,665 26,617 (29.4) 16.0 7.4 24.1 0.9 (2.6) (2.1) 4.4 $22,687,800 100.00 $1,691,688 $1,362,999 $1,691,688 $1,362,999 July is usually not a significant month, representing only 6 percent of the FY20 forecast. The July increase was largely due to timing of late individual and corporate estimated or final payments due June 1. - Over $250 million in July payments were due June 1. 22
Fall Forecasting Process Will Begin in September Trends in revenue collections over the next few months will be incorporated into the fall forecasting process. September: Individual, corporate, and insurance estimated payments are due. October: Retailer s corporate estimated payments are due. Joint Advisory Board of Economists (JABE) reviews economic projections for current biennium. November: Corporate refunds from extension returns peak. Individual income tax extension returns due November 1. Governor s Advisory Council on Revenue Estimates (GACRE) reviews revenue forecast for the 2020 - 2022 biennium. December: General fund revenue forecast finalized. Governor Northam s amendments to the FY 2020 - 2022 budget are presented to the Joint Money Committee (December 16). 23
Virginia - Authorized Use of Coronavirus Relief Fund as of 8-12-2020 Total Allocation to Virginia less Fairfax County Balance for Rest of State $ 3,309,738,321 (200,235,485) $ 3,109,502,836 When Allocated/Committed 1 FY 2020 Less Current Commitments: FY 2021 Total 1st round of local allocations (644,573,383) (644,573,383) VDEM - testing (42,338,400) (42,338,400) VDEM - PPE (97,000,000) (97,000,000) VDEM - other (33,722,001) (33,722,001) VDH - replace deficit authorization (3,291,300) (3,291,300) VDH - contact tracing/UVA Equipment (59,157,614) (59,157,614) DGS - consolidated labs (6,052,673) (6,052,673) DHCD - emergency housing for homeless (5,528,998) (5,528,998) FY 2020 agency-based requests (includes $10M for mortgage and rental assistance mentioned in next item) (90,480,698) (90,480,698) DHCD - Continuation of FY 2020 mortgage and rental assistance ($10M in FY 2020, $40M in FY 2021) (40,000,000) (40,000,000) DSBSD - small business assistance grants (70,000,000) (70,000,000) DMAS - Long-term care facilities (55,640,872) (55,640,872) DMAS - PPE for Personal Care Attendants (9,256,178) (9,256,178) 2nd round of local allocations (644,573,383) (644,573,383) DHCD - emegency housing for homeless (3,300,000) (3,300,000) VDACS - Continuation of FY 2020 program Food Insecurity - CRF portion of Governor's amendments (1,211,953) (1,211,953) DSS - Food Security - expand emergency food supply package - CRF portion of Governor's amendments (650,000) (650,000) VDEM - Food Security - purchase 1 million MREs - CRF portion of Governor's amendments (2,000,000) (2,000,000) Total Commitments (982,145,067) (826,632,386) (1,808,777,453) Remaining Balance $ 1,300,725,383 1NOTE: Not all funds allocated have been spent as of the date of this report. Balances remain in some items. 25
2018-2020 BIENNIUM GF OPERATING BUDGET = $44.2 BILLION Chapter 854, 2019 Acts of Assembly (Dollars in Millions) Personal Property Tax Relief $1,900.0 4% Corrections $2,958.4 7% General Government $1,798.6 4% Higher Education $4,164.5 9% Behavioral Health/Dev Svcs $1,742.8 4% Debt Service $1,511.6 3% Other Public Safety and Homeland Security $1,230.8 3% Medicaid $10,168.1 23% Other $8,452.1 19% Revenue Stabilization Fund / Revenue Reserve $926.0 2% Legislative and Judicial $1,198.1 3% Agriculture, Forestry, Natural Resources $475.6 1% K-12 Education $12,775.6 29% Commerce and Trade $533.8 1% Other Health and Human Resources $1,973.4 5% All Other $833.5 2% 26
2018-2020 BIENNIUM NGF BUDGET = $79.2 BILLION Chapter 854, 2019 Acts of Assembly (Dollars in Millions) Capital Outlay $2,798.2 3% Higher Education $18,852.4 24% Public Safety and Homeland Security $2,291.0 3% K-12 Education $3,648.0 5% Medicaid $18,139.7 23% Other Health and Human Resources $5,819.8 7% Transportation $15,788.4 20% Administration $4,881.0 6% All Other $6,959.6 9% 27
Appendix Fiscal Year 2020 General Fund Collections: Actual and Official Forecast Interim General Fund Forecast for Fiscal Year 2021-22 Interim Commonwealth Transportation Fund Forecast for Fiscal Year 2021-22 Growth in Total General Fund Revenues, Fiscal Years 1961 to 2022 June 2020 Revenue Report July 2020 Revenue Report Note: General Fund Preliminary Annual Report, August, 2020 is available at the Department of Accounts website: www.doa.virginia.gov This presentation is available at the Secretary of Finance website: www.finance.virginia.gov 28


![READ⚡[PDF]✔ Yup I'm Dead...Now What? The Deluxe Edition: A Guide to My Life Info](/thumb/20463/read-pdf-yup-i-m-dead-now-what-the-deluxe-edition-a-guide-to-my-life-info.jpg)


