Visual Analytics in Interactive Arts & Technology - Introduction by Chris Shaw
Explore the world of visual analytics with Dr. Chris Shaw in this interactive course covering graphics, bioinformatics, and virtual reality. Learn about information visualization, design principles, and hands-on projects. Suitable for students with a background in design and software development.
Download Presentation

Please find below an Image/Link to download the presentation.
The content on the website is provided AS IS for your information and personal use only. It may not be sold, licensed, or shared on other websites without obtaining consent from the author. If you encounter any issues during the download, it is possible that the publisher has removed the file from their server.
You are allowed to download the files provided on this website for personal or commercial use, subject to the condition that they are used lawfully. All files are the property of their respective owners.
The content on the website is provided AS IS for your information and personal use only. It may not be sold, licensed, or shared on other websites without obtaining consent from the author.
E N D
Presentation Transcript
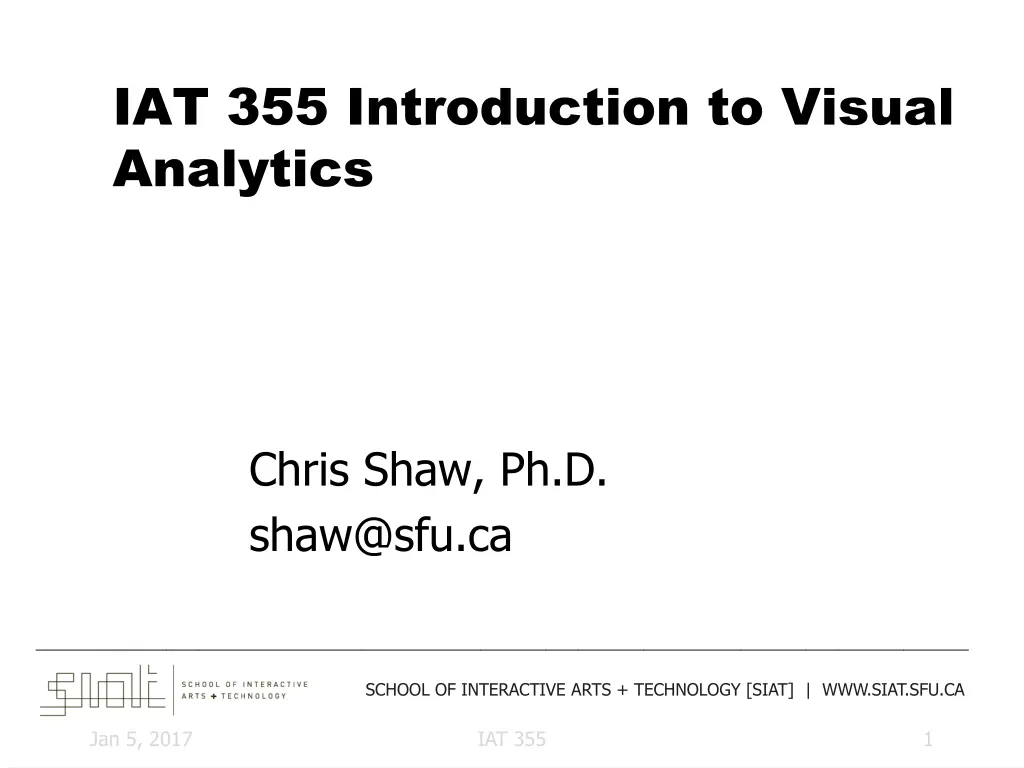
IAT 355 Introduction to Visual Analytics Chris Shaw, Ph.D. shaw@sfu.ca ______________________________________________________________________________________ SCHOOL OF INTERACTIVE ARTS + TECHNOLOGY [SIAT] | WWW.SIAT.SFU.CA Jan 5, 2017 IAT 355 1
Introductions Instructor Chris Shaw shaw@sfu.ca Graphics Visual Analytics Bioinformatics Visualization Two-Handed 3D interfaces Scientific & Information Visualization Virtual Reality Software Jan 5, 2017 IAT 355 2
Introductions TA Ankit Gupta aga53@sfu.ca Jan 5, 2017 IAT 355 3
Topics Information Visualization Representation Presentation Interaction Object-Oriented Programming Computer Graphics Jan 5, 2017 IAT 355 4
What You Will Do Design and Build Visualizations Assignments Small Project Exam Jan 5, 2017 IAT 355 5
Course Information Grading Project (2 parts) Homeworks Final Exam 12.5% each --> 25% 35% 40% Jan 5, 2017 IAT 355 6
Expected Audience People in 3rd year Some experience with design Some experience with building software Jan 5, 2017 IAT 355 7
Two Levels of Design 2 Levels of Designing things: WHAT HOW Jan 5, 2017 IAT 355 8
WHAT What is WHAT? The first design task is to figure out WHAT to design Talk to customers, Dream up a great idea, etc Refine an existing design Jan 5, 2017 IAT 355 9
HOW What is HOW? As one becomes more clear about WHAT, You can start to figure out HOW to design/build it. HOW follows WHAT (Although they may co-evolve as you learn more about the problem) What we do at SIAT is WHAT and HOW Jan 5, 2017 IAT 355 10
Why? We are in a new era of human history: Since 1994 we have witnessed an information explosion. (duh) Everyone can get all of the data that s out there News, sports, financial, purchases, etc... Jan 5, 2017 IAT 355 11
Kegs of data Between 1.8 zettabytes of unique data produced per year 1800000000000000000000 (1021) bytes 300 gig for every person Printed documents only .003% of total Lyman and Varian, 2000 Cal-Berkeley, Info Mgmt & Systems www.sims.berkeley.edu/how-much-info 90 trillion emails sent on the Internet in 2009 Jan 5, 2017 IAT 355 12
Unlike Before Used to be (20 years ago), you had to go to a library read the info, put it on some sort of storage device, take notes, run a specialized program On a computer 1000 times slower than today Now: How do we make sense of the data? How do we harness this data in decision making processes? How do we avoid being overwhelmed? Jan 5, 2017 IAT 355 13
The only reasonable solution Computing + Human Vision Highest bandwidth sense Fast, parallel Pattern recognition Extends memory and cognitive capacity Many People think visually Jan 5, 2017 IAT 355 14
Questions: Which state has the highest income? Is there a relationship between income and education? Are there any outliers? Jan 5, 2017 IAT 355 15
Spotfire: Visualize the data College Degree % Per Capita Income Jan 5, 2017 IAT 355 16
Visualization It s tempting to think that Visualization is about pictures Really, it s a tool to help you think about a problem and learn something A cognitive process helped by pictures The purpose of visualization is insight, not pictures Fred Brooks, quoting Claude Shannon Insight: discovery, decision making, explanation Jan 5, 2017 IAT 355 17
Main Idea Visuals help us think Provide a frame of reference, a temporary storage area External cognition Role of external world in thinking and reason Jan 5, 2017 IAT 355 18
Information Visualization What is information ? Items, entities, things which do not have a direct physical correspondence Notion of abstractness of the entities is important too Examples: baseball statistics, stock trends, connections between criminals, car attributes... Jan 5, 2017 IAT 355 19
What is Visualization? The use of computer-supported, interactive visual representations of data to amplify cognition. From [Card, Mackinlay Shneiderman 98] Jan 5, 2017 IAT 355 20
Scientific Visualization This is a branch of Visualization that helps people understand things that have a built-in geometry. Fluid flow past a ship hull Volume rendering of human body Weather in BC Forces on a turbine blade Jan 5, 2017 IAT 355 21
SciVis vs InfoVis With SciVis: you have the geometry already With InfoVis: Must create a mapping from Information to geometry Map info to 2D or 3D space Give the info a visual representation Both: Enable interaction with the visual data Jan 5, 2017 IAT 355 22
Domains of Info Vis Text Statistics Financial/business data Internet information Linkages between various things Software Jan 5, 2017 IAT 355 23

![❤[READ]❤ Deep Space Craft: An Overview of Interplanetary Flight (Springer Praxis](/thumb/21511/read-deep-space-craft-an-overview-of-interplanetary-flight-springer-praxis.jpg)

