Visual Representation of Relationships Between Real Numbers in Sets
Explore the visual representation of relationships between sets of real numbers, including subsets, in the context of 8th-grade math topics such as approximating irrational numbers, converting between decimal and scientific notation, ordering sets of real numbers, and more.

Download Presentation

Please find below an Image/Link to download the presentation.
The content on the website is provided AS IS for your information and personal use only. It may not be sold, licensed, or shared on other websites without obtaining consent from the author. If you encounter any issues during the download, it is possible that the publisher has removed the file from their server.
You are allowed to download the files provided on this website for personal or commercial use, subject to the condition that they are used lawfully. All files are the property of their respective owners.
The content on the website is provided AS IS for your information and personal use only. It may not be sold, licensed, or shared on other websites without obtaining consent from the author.
E N D
Presentation Transcript
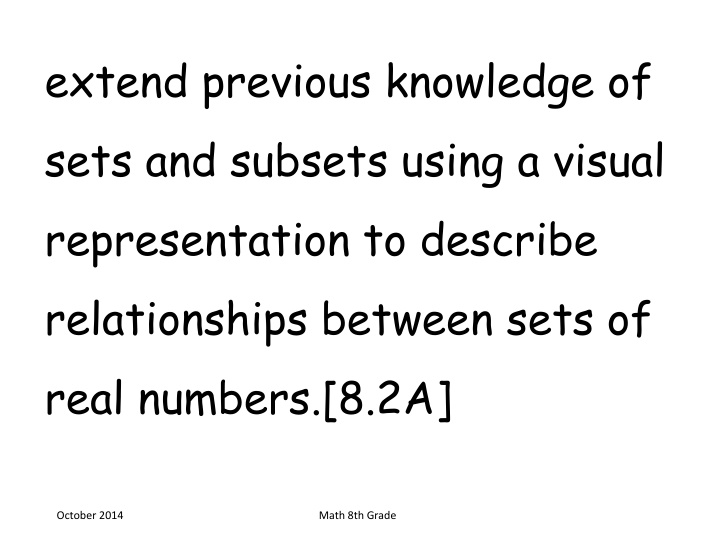
extend previous knowledge of sets and subsets using a visual representation to describe relationships between sets of real numbers.[8.2A] October 2014 Math 8th Grade
approximate the value of an irrational number, including and square roots of numbers less than 225, and locate that rational number approximation on a number line.[8.2B] October 2014 Math 8th Grade
convert between standard decimal notation and scientific notation.[8.2C] October 2014 Math 8th Grade
order a set of real numbers arising from mathematical and real-world contexts.[8.2D] October 2014 Math 8th Grade
generalize that the ratio of corresponding sides of similar shapes are proportional, including a shape and its dilation.[8.3A] October 2014 Math 8th Grade
compare and contrast the attributes of a shape and its dilation(s) on a coordinate plane.[8.3B] October 2014 Math 8th Grade
use an algebraic representation to explain the effect of a given positive rational scale factor applied to two-dimensional figures on a coordinate plane with the origin as the center of dilation.[8.3C] October 2014 Math 8th Grade
use similar right triangles to develop an understanding that slope, m, given as the rate comparing the change in y-values to the change in x-values, (y - y ) / (x - x ), is the same for any two points (x , y ) and (x , y ) on the same line.[8.4A] October 2014 Math 8th Grade
graph proportional relationships, interpreting the unit rate as the slope of the line that models the relationship.[8.4B] October 2014 Math 8th Grade
use data from a table or graph to determine the rate of change or slope and y- intercept in mathematical and real-world problems.[8.4C] October 2014 Math 8th Grade
represent linear proportional situations with tables, graphs, and equations in the form of y = kx.[8.5A] October 2014 Math 8th Grade
represent linear non- proportional situations with tables, graphs, and equations in the form of y = mx + b, where b 0.[8.5B] October 2014 Math 8th Grade
contrast bivariate sets of data that suggest a linear relationship with bivariate sets of data that do not suggest a linear relationship from a graphical representation.[8.5C] October 2014 Math 8th Grade
use a trend line that approximates the linear relationship between bivariate sets of data to make predictions.[8.5D] October 2014 Math 8th Grade
solve problems involving direct variation.[8.5E] October 2014 Math 8th Grade
distinguish between proportional and non- proportional situations using tables, graphs, and equations in the form y = kx or y = mx + b, where b 0.[8.5F] October 2014 Math 8th Grade
identify functions using sets of ordered pairs, tables, mappings, and graphs.[8.5G] October 2014 Math 8th Grade
identify examples of proportional and non- proportional functions that arise from mathematical and real-world problems.[8.5H] October 2014 Math 8th Grade
write an equation in the form y = mx + b to model a linear relationship between two quantities using verbal, numerical, tabular, and graphical representations.[8.5I] October 2014 Math 8th Grade
describe the volume formula V = Bh of a cylinder in terms of its base area and its height.[8.6A] October 2014 Math 8th Grade
model the relationship between the volume of a cylinder and a cone having both congruent bases and heights and connect that relationship to the formulas.[8.6B] October 2014 Math 8th Grade
use models and diagrams to explain the Pythagorean theorem.[8.6C] October 2014 Math 8th Grade
solve problems involving the volume of cylinders, cones, and spheres.[8.7A] October 2014 Math 8th Grade
use previous knowledge of surface area to make connections to the formulas for lateral and total surface area and determine solutions for problems involving rectangular prisms, triangular prisms, and cylinders.[8.7B] October 2014 Math 8th Grade
use the Pythagorean Theorem and its converse to solve problems.[8.7C] October 2014 Math 8th Grade
determine the distance between two points on a coordinate plane using the Pythagorean Theorem.[8.7D] October 2014 Math 8th Grade
write one-variable equations or inequalities with variables on both sides that represent problems using rational number coefficients and constants.[8.8A] October 2014 Math 8th Grade
write a corresponding real-world problem when given a one-variable equation or inequality with variables on both sides of the equal sign using rational number coefficients and constants.[8.8B] October 2014 Math 8th Grade
model and solve one-variable equations with variables on both sides of the equal sign that represent mathematical and real- world problems using rational number coefficients and constants.[8.8C] October 2014 Math 8th Grade
use informal arguments to establish facts about the angle sum and exterior angle of triangles, the angles created when parallel lines are cut by a transversal, and the angle-angle criterion for similarity of triangles.[8.8D] October 2014 Math 8th Grade
identify and verify the values of x and y that simultaneously satisfy two linear equations in the form y = mx + b from the intersections of the graphed equations.[8.9A] October 2014 Math 8th Grade
generalize the properties of orientation and congruence of rotations, reflections, translations, and dilations of two-dimensional shapes on a coordinate plane.[8.10A] October 2014 Math 8th Grade
differentiate between transformations that preserve congruence and those that do not.[8.10B] October 2014 Math 8th Grade
explain the effect of translations, reflections over the x- or y-axis, and rotations limited to 90 , 180 , 270 , and 360 as applied to two- dimensional shapes on a coordinate plane using an algebraic representation.[8.10C] October 2014 Math 8th Grade
model the effect on linear and area measurements of dilated two-dimensional shapes.[8.10D] October 2014 Math 8th Grade
construct a scatterplot and describe the observed data to address questions of association such as linear, non- linear, and no association between bivariate data.[8.11A] October 2014 Math 8th Grade
determine the mean absolute deviation and use this quantity as a measure of the average distance data are from the mean using a data set of no more than 10 data points.[8.11B] October 2014 Math 8th Grade
simulate generating random samples of the same size from a population with known characteristics to develop the notion of a random sample being representative of the population from which it was selected.[8.11C] October 2014 Math 8th Grade
solve real-world problems comparing how interest rate and loan length affect the cost of credit.[8.12A] October 2014 Math 8th Grade
calculate the total cost of repaying a loan, including credit cards and easy access loans, under various rates of interest and over different periods using an online calculator.[8.12B] October 2014 Math 8th Grade
explain how small amounts of money invested regularly, including money saved for college and retirement, grow over time.[8.12C] October 2014 Math 8th Grade
calculate and compare simple interest and compound interest earnings.[8.12D] October 2014 Math 8th Grade
identify and explain the advantages and disadvantages of different payment methods.[8.12E] October 2014 Math 8th Grade
analyze situations to determine if they represent financially responsible decisions and identify the benefits of financial responsibility and the costs of financial irresponsibility.[8.12F] October 2014 Math 8th Grade
estimate the cost of a two-year and four-year college education, including family contribution, and devise a periodic savings plan for accumulating the money needed to contribute to the total cost of attendance for at least the first year of college.[8.12G] October 2014 Math 8th Grade