Visualizing Categorical Data: Frequency Tables, Distributions, and Examples
Explore how to create and interpret frequency tables for categorical data, understand different types of distributions like bar charts and contingency tables, and delve into examples involving hospitals to grasp concepts of probability and conditional distributions.

Download Presentation

Please find below an Image/Link to download the presentation.
The content on the website is provided AS IS for your information and personal use only. It may not be sold, licensed, or shared on other websites without obtaining consent from the author. If you encounter any issues during the download, it is possible that the publisher has removed the file from their server.
You are allowed to download the files provided on this website for personal or commercial use, subject to the condition that they are used lawfully. All files are the property of their respective owners.
The content on the website is provided AS IS for your information and personal use only. It may not be sold, licensed, or shared on other websites without obtaining consent from the author.
E N D
Presentation Transcript
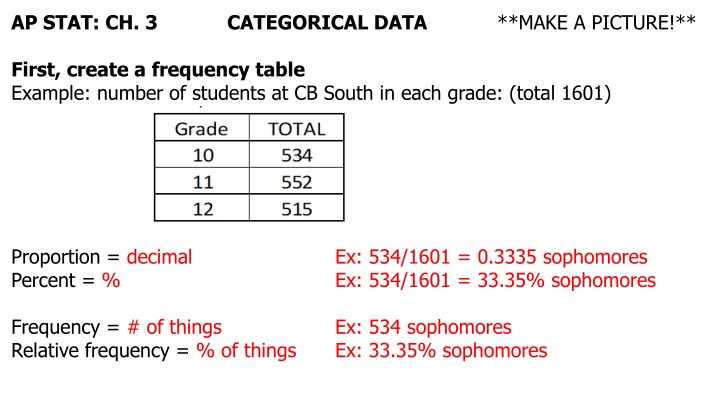
AP STAT: CH. 3 CATEGORICAL DATA **MAKE A PICTURE!** First, create a frequency table Example: number of students at CB South in each grade: (total 1601) Proportion = decimal Percent = % Ex: 534/1601 = 0.3335 sophomores Ex: 534/1601 = 33.35% sophomores Frequency = # of things Relative frequency = % of things Ex: 534 sophomores Ex: 33.35% sophomores
Distribution (of a variable)- shows values of the variable & how often the sample takes each value Examples: Bar chart, pie chart, histogram, stemplot, etc. Categorical Distributions: 1. Bar Chart
3. Contingency tables (aka Two-Way tables) Identify: Row variable = GENDER (2 values: Male/Female) Column variable = GRADE (4 values: Fr, So, Jr, Sen) Values of the variable = the different rows/columns Total (n) = bottom right of chart # of Cells (doesn't count totals) Totals (margins)
Example: Hospitals * What percent of people died? Notation: Probability: Given/Of: And: Or: * Of those people that went to Hospital A, what percent died? * What percent of people went to Hospital A and survived? * What percent of people went to Hospital B or died?
* Given that someone went to Hospital B, what's the chance that they died? * Of those people who died, what percent went to Hospital A? * What percent of people died and went to Hospital B? * What percent of people survived or went to Hospital A?
2 types of Distributions for Categorical Variables 1) MARGINAL DISTRIBUTIONS How to make: convert totals into % s * Marginal distribution of HAIR COLOR: * Marginal distribution of GENDER: * Visually: BAR GRAPH
2) Look at one variable Then look at each value of the variable Break down each value into its pieces ALWAYS in % Find the conditional distribution of hair color: CONDITIONAL DISTRIBUTIONS
Independence: - When one variable has no effect on the another variable How do we tell independence? When the conditional distribution looks the same throughout all values of the variable (when all bars of the conditional look approx. the same). The same = each category within 5% Independent: Dependent:
How to answer independent/dependent: * Yes/No Variable 1 is independent of Variable 2. Ex: No, hair color and gender are dependent. * All values of the variable are similar to each other Ex: All values of hair color are not similar between males and females. * Give an example of the values Ex: the males had 41.3% with brown hair, whereas the females had only 27.4% with brown hair. synonyms: independent = no association = no relationship

- shows values of the variable &")


")