Visualizing Statistical Concepts Using Geometry
Explore a unique pedagogical approach in statistics instruction by employing geometry to visualize abstract aspects of statistical formulae relevant to correlation and regression. This method aims to cater to diverse learning styles while maintaining accuracy and rigor, providing students with a more visual representation of statistical concepts. Discover how the geometric approach can enhance understanding and unify basic statistical techniques through previous applications and insights. Learn why this approach hasn't been widely adopted before and delve into correlations and computational aspects related to statistical analysis.

Download Presentation

Please find below an Image/Link to download the presentation.
The content on the website is provided AS IS for your information and personal use only. It may not be sold, licensed, or shared on other websites without obtaining consent from the author. If you encounter any issues during the download, it is possible that the publisher has removed the file from their server.
You are allowed to download the files provided on this website for personal or commercial use, subject to the condition that they are used lawfully. All files are the property of their respective owners.
The content on the website is provided AS IS for your information and personal use only. It may not be sold, licensed, or shared on other websites without obtaining consent from the author.
E N D
Presentation Transcript
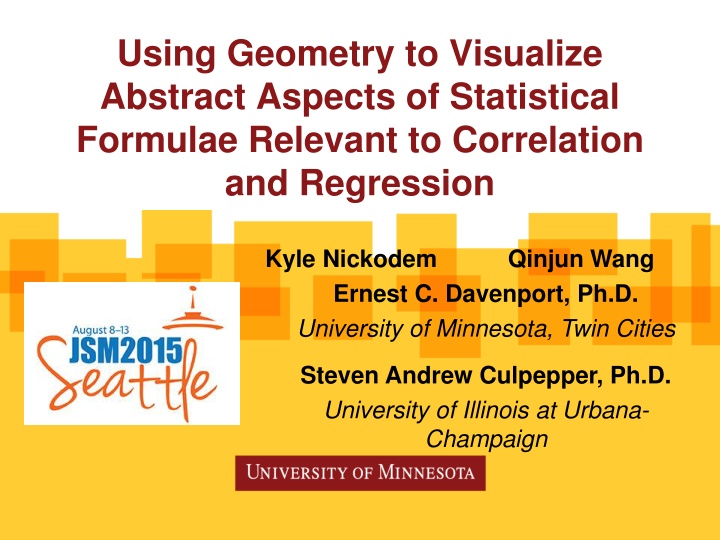
Using Geometry to Visualize Abstract Aspects of Statistical Formulae Relevant to Correlation and Regression Kyle Nickodem Ernest C. Davenport, Ph.D. University of Minnesota, Twin Cities Qinjun Wang Steven Andrew Culpepper, Ph.D. University of Illinois at Urbana- Champaign
Objective Provide an alternative pedagogy for introductory statistics instruction that satisfies different learning styles without a loss of accuracy and rigor Provide a visual representation of statistical concepts enabling students to see statistics
Common Instruction Algebraic and analytic approach Explains the underlying mathematics and the vehicle for computation Computational approach Focus on learning the software to transform data into interpretable results
Geometric Approach Use of geometry clarifies and unifies our understanding of the basic statistical techniques - Saville & Wood, 2012 Previous applications of geometry Least Squares (DeLaubenfels, 2006) Randomized block design and simple linear regression (Saville & Wood, 1986) Conditions for suppressor variables (Schey, 1993) Comparing variables in regression (Bring, 1996)
Why hasnt it been used more? At one point was computationally more difficult Misconception only for use in advanced students, but not for the masses Tradition 20th century was the age of algebra (Herr, 1980; Saville & Wood, 2012)
Correlations Algebraic/Analytic ? ?? ? ?? ? ??? ?2 Bivariate ???= ?? ?2 ??? ?????? Partial ???.?= 2 2 1 ??? 1 ??? ??? ?????? Part ???.?= 2 1 ???
Correlation - Computational ACT 1.00 HSR 0.36 1.00 %NFR 0.24 -0.10 1.00 A T 0.45 0.79 0.53 1.00 ACT HSR %NFR A T Partial Correlation Part Correlation 0.40 0.39 0.30 0.28 Note. The part and partial correlations were calculated with ACT Composite as the dependent variable. All bivariate, partial, and part correlations were significant at the 0.001 rejection level. ACT = ACT Composite, HSR = High school percentile rank, %NFR = % non-free/reduced priced lunch students in the high school, A T is the predicted ACT value with HSR and %NFR as independent variables.
Correlation - Geometric Bivariate ???= cos ? ACT ACT 292.2 292.2 272.7 283.6 76 degrees r = 0.24 69 degrees r = 0.36 104.7 70.3 80 0 20 40 60 100 80 0 20 40 60 100 High School Percentile Rank % non-Free/Reduced Lunch
Regression: ACT ~ HSR ????= ?01+ ?11????+ ??1 Sum of Squares 10,965.6 74,388.1 85,353.7 df 1 F P-Value SSModel SSResidual SSTotal 438.3 <0.001 2,973 2,974 2+ ? ? 2 ? ?2= ? ? SST = SSM + SSR c2 = a2 + b2
Analytic to Geometric ???= 10,965.6 = 104.7 ???= 74,388.1 = 272.7 ACT 292.2 272.7 ???= 85,353.7 = 292.2 69 degrees r = 0.36 104.7 80 0 20 40 60 100 High School Percentile Rank
Regression: ACT ~ %NFR ????= ?02+ ?22%????+ ??2 Sum of Squares 4,935.8 80,417.9 85,353.7 df 1 F P-Value SSModel SSResidual SSTotal 182.5 <0.001 2,973 2,974 2+ ? ? 2 ? ?2= ? ? SST = SSM + SSR c2 = a2 + b2
Analytic to Geometric ???= 4,935.8 = 70.3 ???= 80,417.9 = 283.6 ACT 292.2 283.6 ???= 85,353.7 = 292.2 76 degrees r = 0.24 70.3 80 0 20 40 60 % non-Free/Reduced Lunch
Multiple Regression ????= ?00+ ?10????+ ?20%????+ ??0 Sum of Squares 17,639.5 67,714.2 85,353.7 df 2 F P-Value SSModel SSResidual SSTotal 387.1 <0.001 2,972 2,974 2+ ? ? 2 ? ?2= ? ? SST = SSM + SSR c2 = a2 + b2
ACT H 292.2 283.6 76 degrees r = 0.24 70.3 80 0 20 40 60 100 H % non-Free/Reduced Lunch ACT 292.2 G G 272.7 69 degrees r = 0.36 104.7 80 0 20 40 60 100 High School Percentile Rank
???,%???= ? = ??? 17,639.5 = ???.? ???,%??? ??? %??? = ? = ??? H 17,639.5 4,935.8 = ???.? ???,%??? ??? ??? = ? = ??? G 17,639.5 10,965.6 = ??.?
Partial and Part Partial HSR = B/G = 112.7 / 283.6 = .40 %NFR = C/H = 81.7 / 272.7 = .30 H Part HSR = B/ACT = 112.7 / 292.2 = .39 %NFR = C/ACT = 81.7 / 292.2 = .28 G
Correlation - Computational ACT 1.00 HSR 0.36 1.00 %NFR 0.24 -0.10 1.00 A T 0.45 0.79 0.53 1.00 ACT HSR %NFR A T Partial Correlation Part Correlation 0.40 0.39 0.30 0.28 Note. The part and partial correlations were calculated with ACT Composite as the dependent variable. All bivariate, partial, and part correlations were significant at the 0.001 rejection level. ACT = ACT Composite, HSR = High school percentile rank, %NFR = % non-free/reduced priced lunch students in the high school, A T is the predicted ACT value with HSR and %NFR as independent variables.
Educational Importance The geometric approach: Supplements and unifies the algebraic, analytic, and computational approaches More accommodating to visual learners Emphasizes the interrelationship between variables and their underlying structure May enhance abstract and spatial thinking
Next Steps Compare the effectiveness of the different approaches on students learning of statistics Including motivations, attitudes, and beliefs High school, undergraduate, and graduate levels Gender and cultural differences Curriculum development Teaching software
Thank you! Kyle Nickodem University of Minnesota nicko013@umn.edu