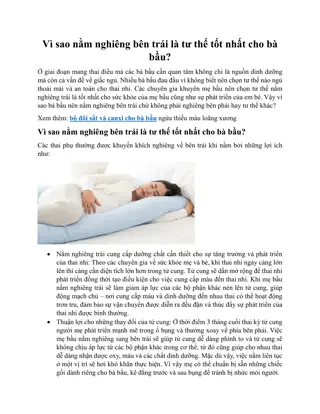
VIX Manipulation: Mechanics, Characteristics, and Steps
Explore the potential for manipulation in the VIX index, delving into the mechanics of VIX calculation, characteristics that make manipulation possible, and steps involved in manipulating the VIX. Understand how lower-level SPX options impact VIX settlement values and the strategies that manipulators may employ.

Download Presentation

Please find below an Image/Link to download the presentation.
The content on the website is provided AS IS for your information and personal use only. It may not be sold, licensed, or shared on other websites without obtaining consent from the author. If you encounter any issues during the download, it is possible that the publisher has removed the file from their server.
You are allowed to download the files provided on this website for personal or commercial use, subject to the condition that they are used lawfully. All files are the property of their respective owners.
The content on the website is provided AS IS for your information and personal use only. It may not be sold, licensed, or shared on other websites without obtaining consent from the author.
E N D
Presentation Transcript
Manipulation in the VIX? JOHN M. GRIFFIN and AMIN SHAMS PRESENTED BY MATTEO CARACCIOLO-KING
Overview The Chicago Board Options Exchange (CBOE) Volatility Index (VIX) is a widely tracked index that gauges the 30-day implied volatility of the market, often referred to as a market 'fear-gauge . Every month, a settlement occurs where the value of monthly VIX derivatives is set equal to the VIX value calculated from SPX options. A manipulator would need to move the prices of these lower-level OTM SPX options at settlement to influence the value of expiring upper-level VIX derivatives. At the settlement time of the VIX Volatility Index, volume spikes on S&P 500 Index (SPX) options, but only in out-of-the-money options that are used to calculate the VIX, and more so for options with a higher and discontinuous influence on VIX. Paper will examine alternate explanations for this rise in volume Finally, paper will examine prices, costs , and mechanics of manipulation
VIX Mechanics Vix uses premium investors are willing to pay for calls and puts at various strike prices to gauge the volatility of the market Because of the use of and interest in the VIX, the index is updated every 15 seconds Settlement of VIX derivatives is done on the 3rdor 4thWednesday every month Settlement value is calculated using auction clearing SPX option prices. This is done during an auction called the Special Opening Quotation (SOQ) to be included in this auction orders must be submitted prior to market open Starting at 7:30 CST best bid and ask can be seen by market participants Between 8:15 and 8:30 am orders related to VIX cannot be submitted (Strategy Orders) Only options that expire in exactly 30 days are used for VIX settlement calculations No ITM options used in calculation all OTM options used as long as option is not 0 bid
Characteristics of VIX that May Make Manipulation Possible TERMINOLOGY Lower Level -SPX options used to calculate VIX settlement value Upper Level -VIX index and products calculated using SPX options Upper level derivative market is large and liquid lower level SPX options are often illiquid Inclusion of the illiquid derivatives can lead to unnecessary variation in the VIX VIX derivatives are cash settled so positions can be cashed out at prices that are deviated from true value . This is opposed to physical delivery where one has to take possession of asset with an inflated value Pre open auction makes altering the VIX settlement value possible by changing auction clearing price of lower level SPX options
Steps to manipulate the VIX 1) Open long (short) position in the VIX derivatives prior to settlement 2) Submit aggressive buy (sell) orders in the lower level market for SPX options that are used in VIX settlement calculation. The variance in the SPX option market will translate into variance in the VIX settlement calculation. 3) Close out VIX derivatives at a higher price due to change caused in VIX settlement price
VIX FORMULA Q(Ki) = price of that option T = time to expiration Ki = average distance between the strike price of the ith OTM option and the strike prices above and below option i R = risk-free interest rate Ki =the strike price for the ith OTM option F = forward index level = Strike Price + e^(RT) x (Call Price - Put Price) where Strike price has smallest abs(Call price Put price) K0 = first strike price below forward index level
Testable Predictions Volume spikes in the SPX options will be examined at the VIX settlement. This activity will be compared to non settlement times and similar options with no upper-level derivatives SPX OTM options used in settlement calculation will be compared to SPX ITM options not used in settlement Will check if volume and relative price deviations increase as put options become more OTM Will check if trading increases around Ki thresholds
Volume Patterns At Settlement Volume spike at 30 days priors to expiration this is the date that the VIX settles Volume of SPX options compared to OEX (S&P 100) and SPY (S&P 500) these track each other very closely No volatility index calculated from SPY options - VXO volatility index calculated from OEX but does not have tradable derivatives This shows that it is not probable that there is another event besides settlement that causes volume to spike as we would see this spike in the OEX and SPY options as well
Volume Patterns at Settlement (Cont.) Figure shows that volume spike is completely driven by OTM options, which are the ones used for VIX settlement OLS estimates where dependent variable is daily trade volume of SPX options Settlement Day x OTM is significant
VIX Sensitivity and Option Volumes keeping everything else constant Someone wishing to manipulate VIX would focus on trading on strikes with high sensitivity Settlement trading patterns show increase with the out of moneyness of the strike, which is consistent with the sensitivity patterns Sensitivity for each strike is calculated as basis point change in VIX as a result of $.05 change in that specific option s price
Discontinuity in VIX Sensitivity Here they flag two strikes that have different K and denote the one with a higher K the jump Then they sort the strikes above and below the jump relative to the jump , sensitivity and volume are then normalized relative to the jump and averaged across different jumps Higher K translates into higher VIX sensitivity as shown in formula and Panel A Panel B shows large jump in trading at jump for high K stocks consistent with manipulation hypothesis
Alternative Explanations Overview The settlement period is a time of coordinate liquidity trading This theory explores the opportunity that VIX settlement auction provides those with pent-up demand for illiquid OTM options to trade because of their belief that others will participate in auction Hedgers could open SPX options to hedge VIX derivative positions and then close these positions out when VIX derivatives settle Hedgers could be rolling over their VIX derivative positions to underlying SPX options when the VIX derivatives expire
Liquidity Theory Regress settlement trade volume on pre-auction liquidity Liquidity would predict a negative relationship between the two but we see that this is not the case for call options This is consistent with manipulation hypothesis because OTM calls are not sought after because of their low sensitivity
Liquidity Theory tested in VSTOXX VSTOXX excludes options with price under 0.5 Liquidity theory would predict high volume for low strike options under 0.5 but as we see volume is very low High volume at threshold sits well with manipulation theory because these options are very important as they run the risk of being excluded from the calculation VSTOXX settlement is calculated as average value from 11:30 to 12 pm on settlement day this value is calculated every 5 seconds We see spikes in volume traded precisely every 5 seconds there is no reason for a trader seeking liquidity to trade this way- however it fits the pattern of behavior of a manipulator
Unwinding Previous Hedges Theory If someone were to take position in the options prior to expiration and then unload them, then there should be large interest in deep OTM put options prior to settlement. However, there is not significant interest in deep OTM put options prior to settlement. It is impossible for a trader to know exactly which options will be included in settlement when he opens a position in SPX options to hedge his VIX derivative positions. This will leave him with some options that were OTM when the trade was initialized but have become ITM by settlement. This should leave us with high volumes of trading at for strikes that are barely ITM/OTM but this is not the case.
Hedge Rollover Theory VSTOXX trading patterns negate this because a trader wanting to rollover would trade at 12pm when his positions expire. The 5 second interval trading pattern is inconsistent with this strategy but consistent with the manipulation one. For a trader looking to rollover their hedge there is nothing special about 11:30 am so this spike does not fit the Hedge Rollover Theory
Prices, Costs and Mechanics of Manipulation Price Movement in SPX Options time decay and overnight changes in volatility Options sorted by their bid-ask spread right after market opens and pooled across several settlement days Size of bubble is proportional to the number of observations Depending on the deviation we see prices cluster around bid or ask Compare prices at open and previous close to settlement price prices are adjusted for movement of the underlying index,
Deviation in the VIX and its Causes To gauge how movements in SPX options translate into movements in the VIX the authors calculate an open benchmark for the VIX This benchmark VIX is calculated from the mid-quote SPX options right after the market opens. The benchmark uses the same chain of options used in the VIX settlement to control for changes caused by different strikes being included. Average absolute value of deviations is 31 basis points per day Examine deviation caused by each SPX option by calculating VIX using individual option at settlement price and holding all other options at open benchmark level. Find that in days with large positive deviations 29% of the deviation is caused by close in OTM puts, 22% from deeper OTM puts, 22 % from very deep OTM puts and 28 % from calls For negative days the numbers are 44%, 24%,10%,23%
Are the Distortions Sizable ? VIX derivatives at settlement This calculation is made on Futures and ITM VIX options Distortion cost from 2008 to 2015 are estimated to be $1.81 billion Distortions in other volatility indices (Crude oil, Russel 2000 ect.) are estimated at $11.34 million Market distortion caused by settlement deviations is calculated by multiplying deviation in the index by the open interest in
Do Deviations Provide Arbitrage Opportunities? CBOE reports VIX levels calculated using ask quotes and bid quotes The average spread from 2008 to 2015 is 1.55 VIX units or 6.8% As long as deviation is within spread it is not the case the someone can immediately arbitrage away the difference Large spread of SPX options outside of settlement leaves possibility that large deviations are not corrected Authors finds that 14% of SPX options settlement prices fall outside of spread at open and 27% out of this spread at close
Is cost of Pushing Prices Justified by Benefits For manipulation to be profitable, profits from altering VIX must be greater than costs of altering SPX option prices Compare Vega exposure of VIX derivative market to Vega exposure of settlement time SPX derivative market Upper level market is 13 times the SPX volume at settlement in terms of Vega exposure This indicates that manipulation is feasible for a trader that holds sizable fraction of upper- level market
How are Prices Pushed? Graphs shows evolution of OTM put prices during settlement This movement is inline with aggressive buy orders moving the price up The table reports the differences between the average option prices for each two consecutive time periods price(t-1) price(t) Aggressive buying can be seen in the bid ask spread as well at pre-open settlement days we often have negative spreads indicating bid orders exceeding the ask
Conclusion Not only is it possible to alter the VIX settlement, but volume and price patterns are consistent with the hypothesis that this is actively happening Alternative explanations or these patterns are investigated but do not fit the data as well as the manipulation hypothesis Encouraged transparency in trading can counteract increasing complexity


")