Explore the concept of Voronoi diagrams and K-means clustering in data analysis, including their applications, methods, and tools like RStudio. Learn about determining the number of clusters and different linkage methods for data analysis. Figures courtesy of Wako Bungula.
Please find below an Image/Link to download the presentation.
The content on the website is provided AS IS for your information and personal use only. It may not be sold, licensed, or shared on other websites without obtaining consent from the author. If you encounter any issues during the download, it is possible that the publisher has removed the file from their server.
You are allowed to download the files provided on this website for personal or commercial use, subject to the condition that they are used lawfully. All files are the property of their respective owners.
The content on the website is provided AS IS for your information and personal use only. It may not be sold, licensed, or shared on other websites without obtaining consent from the author.
E N D
Presentation Transcript
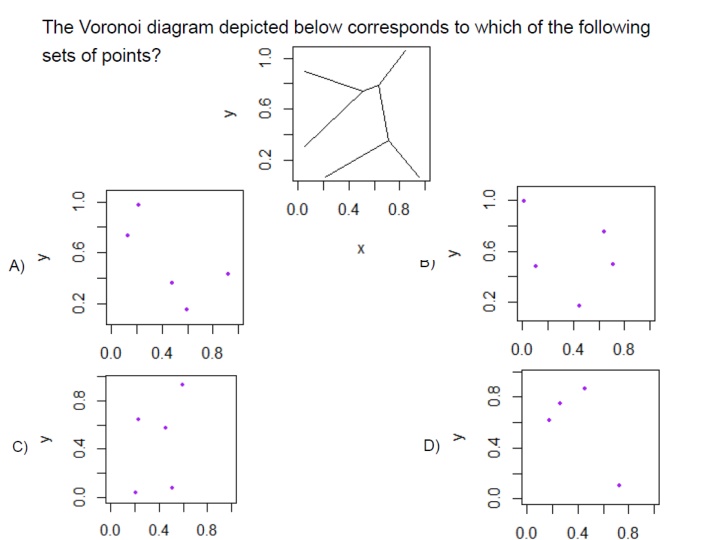
Voronoi diagram: Suppose your data points live in Rn. Choose data point v. The Voronoi cell associated with v is H(v,w) w v U The Voronoi cell associated with v is Cv= { x in Rn : d(x, v) d(x, w) for all w v }
Re-partition data set into 3 voronoi cells corresponding to the 3 centroids Figure modified from https://en.wikipedia.org/wiki/File:K_Means_Example_Step_1.svg
Applications of k-means clustering: 1.) Group like items together 2.) Reduce the size of your data set. 3.) Color quantization. (a) Reduce memory use. (b) Certain devices might have limited number of colors for display.
Rstudio: library("TDA") circle = circleUnif(300, r = 1) plot(circle, asp = 1) cl <- kmeans(circle, 10) plot(circle,col=cl$cluster) points(cl$centers, pch=8, cex = 2) plot(cl$centers, asp = 1)
For k-means, There are many methods for determining k k = number of desired clusters
If you care about closeness: Complete linkage Average linkage Ward s linkage K-means If you care about connected components: Single linkage DBscan Figures courtesy of Wako Bungula