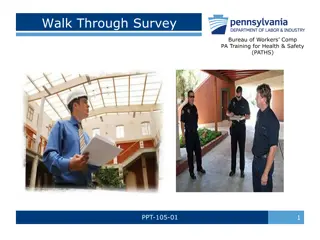
Walk Through Survey for Health & Safety Training
This presentation explores the importance, process, and benefits of conducting a walk-through survey in workplace health and safety training. It covers the differences between surveys and inspections, the significance of observing daily practices, and ensuring compliance with safety protocols.

Download Presentation

Please find below an Image/Link to download the presentation.
The content on the website is provided AS IS for your information and personal use only. It may not be sold, licensed, or shared on other websites without obtaining consent from the author.If you encounter any issues during the download, it is possible that the publisher has removed the file from their server.
You are allowed to download the files provided on this website for personal or commercial use, subject to the condition that they are used lawfully. All files are the property of their respective owners.
The content on the website is provided AS IS for your information and personal use only. It may not be sold, licensed, or shared on other websites without obtaining consent from the author.
E N D
Presentation Transcript
Strategies for Resource Management for better input use efficiency Odisha State
Land use pattern Sl. No. 1. 2. 3. 4. 5. 6. 7. 8. 9. Items Area Forest Miscellaneous Trees & Groves Permanent Pasture Culturable waste Land Put to Non-Agriculture Barren & un-culturable land Current fallow Other fallow Net Area Sown Total Geographical Area Gross cropped area Cropping Intensity (%) 58.13 3.42 4.94 3.75 12.98 8.40 8.49 2.29 53.31 155.71 87.99 166
Cultivated Land Inventory Cultivated Land- 61.80 lakh hectares Cultivated Area Kharif Paddy Area High 29.14 Medium 17.55 Low 15.11 61.80 6.51 16.51 14.91 37.93 Land with Acidic soil - 40 lakh hectares (13 lakh hectares with pH>5.5) 4 lakh hectares 3.54 lakh hectares 0.75 lakh hectares Prone to saline innundation- Prone to flooding - Prone to water logging - Irrigation Potential created (2011-12): Kharif Rabi Average size of holding- Small and Marginal farmers - 30.64 lakh hectares 15.29 lakh hectares 1.15 hectares. 86.2% of the farming community
Fertility and Nutrient Status 70% of our soil affected due to soil acidity (40 lakh ha acidic & 13 lakh ha with pH 5.5) Deficient Nutrients Extent of Defficiency in %) Zinc - 19 % (prevalent in medium & Low Land soils - 44% (majority of upland Soils) Sulphur - 28% Nutrient Status up to Gram Panchayat Level for major nutrients has been uploaded in the website www.orsac.org/natural resources/soilfertility and is available in public domain Soil Health Card Generation has been Made On-Line Boron
Soil Testing & fertiliser use Items Achievement 2013-14 (upto 08/11) 2010-11 2011-12 2012-13 Target 227550 512000 220000 265000 Samples Received Samples Analysed 162085 231694 384418 91615 159593 169207 357611 91615 No. of Health Cards Issued 159593 169207 357611 91615 Consequent up on massive soil testing and recommendations thereof we are inching towards the ideal ratio of N:P:K which is 4:2:1
Extent of fallow land and measures required to bring them to cultivation Fallow land in the state- 11.17 lakh hectsres (nearly 17%) Measures required Taking up different plantation crops in well drained uplands remaining fallow. Growing low duty and fodder crops. Fallow Low land prone to water logging could be exploited for fisheries/ integrated farming systems. Establishment of Irrigation points; bore wells, WHS, farm ponds/ dugwells etc. Treatment of land for reducing soil erosion and runoff losses. Livelihood interventions. Incentivising productive use of fallow land.
Extent of use of subsidy and quality inputs by tenant farmers While providing extension services and different quality agri-inputs farmers are not discriminated for owning land except for infrastructural development. Thus, all the tenant farmer have equal access to quality agri inputs.
Scope for improving Potential and sustainable use of land resources Ample of scope for improving potential of land resources- Exploiting irrigation potential Provisioning appropriate drainage facilities Appropriate and adequate soil amelioration Adoption of proper nutrient and soil management practices. Capacity building of farmers and extension functionaries. Reclamation of degraded land through proper treatment. Reduce the extent of fallow land through proper usage
WATER: Available Water Resources Description Odisha India Annual Precipitation (Annual av. Rainfall 1451 mm) 230.76 BCM 4000 BCM Average Annual Water Resources 141.41 BCM 1869 BCM Utilisable Water Resources (surface + Ground Water) 108.15 BCM 1122 BCM Utilisable Resources (% precipitation) 47% 28% Storage Capacity created (upto 2011-12) 17.01 BCM +1.77 BCM (under constn.) NA Source: Annual Report 2011-12 of Water Resources Department, Govt. Of Odisha
Declining per capita availability of water India India 1820 m3 in 2001 1144 m3 in 2050 Orissa Orissa 3359 m3 in 2001 2218 m3 in 2051 But by 2051: Rushikulya Rushikulya basin will experience a scarcity condition and basins like Budhabalanga Budhabalanga and Bahuda Bahudawill be close to scarcity condition Stress level - 1700 m3/year Scarcity level - 1000 m3/year Absolute scarcity level - < 500 m3/year Courtsey Dr. Lalit Mohan Garnayak, Chief Agronomist, OUAT
Irrigation Out of the cultivated area of 61.80 lak ha about 49.90 lakh ha (Annual Report 2007-08 - water resources Deptt. ) can be brought under assured irrigation. Irrigation potential created in lakh ha (Source-wise) (2012-13) Source Kharif Rabi Major & Medium 13.69 6.27 Minor (flow) 5.95 0.77 Minor (lift) 5.49 3.11 Other Sources 6.17 5.58 Total 31.30 15.73 Irrigation potential utilised Kharif - 20.79 lakh ha Rabi - 10.09 lakh ha (65.7%)
GOUND WATER RESOURCES AVAILABILITY, UTILIZATION AND STAGE OF DEVELOPMENT IN ODISHA Annual Replenishable Ground Water Resource 17.78 bcm Natural Discharge during non- Monsoon season 1.09 bcm Net Annual Ground Water Availability 16.69 bcm Annual Ground Water Draft Irrigation 3.47 bcm (20.8%) Domestic and Industrial uses 0.89 bcm (5.3%) Total 4.36 bcm Stage of Ground Water Development 26 % Source:- Annual Report 2010-11, Central Ground Water Board
Efficiency of Water Use Efficiency of Canal Water use- < 38.5 % Ground water & Surface lifts- 60 % Challenges- Transmission losses on account of unlined and ill maintained distribution channels. Vast coverage under Rice crop (nearly 2/3rd). (the WUE of rice being one of the least) Inadequate spread of Micro irrigation. Due to improper irrigation scheduling. Improper crop planning
Micro irrigation and water Management for WUE Spinkler and drip irrigation systems are being popularised in a massive way. HDPE pipes are being promoted for minimising transmission loss Capacity building for efficient crop planning and water management in ayacuts. PIM and IWRM being promoted through formation of WUA (Pani Panchayats).
Watershed development and rain water harvesting Extent of coverage under watershed During 11th and 12th Plan period (upto 2012-13) 13442 no of Soil Conservation Structures and 1589 nos. of WHS have been established. 2943 ha of Plantation and 7.2 km of avenue plantation have been taken up 5330 micro watersheds implemented covering treatable area of 28.76 lakh hectres. (2753 completed and 2577 are under operation)
Augmentation and application of irrigation water Strategies Lining of canal & Rehabilitation of systems Lining of distributaries and maintenance. Promotion of participatory irrigation management(PIM) & Integrated Water Resources Management (IWRM). Proper crop planning and irrigation scheduling. Adoption of improved methods of irrigation. Adoption of appropriate Water Management practices. Establishment of new irrigation sources.
Energy and Farm Power Level of energy use from different sectors Power consumption - 151 million units (1.16 % of the total consumption) Govt. has decided to install separate Dedicated Agriculture Feeder for supply of power to Agriculture sectors throughout the State. Rs.150 crore has been provided in the budget during Financial Year 2013-14 for this purpose. Optimum use of machinery shall enhance efficiency in energy use. Availability of farm power - 1.405 kW/ha. (To be enhanced to 2 kW/ha by 2020.) Human and draft animal contributes 0.71 kw/ha machinery contribute 0.695 kw/ha Nearly 5.5 lakhs machinery including pump sets are available in the State. 55 lakh Agricultural labour and 80 lakhs draught animal contribute to the Farm Power. Access of Smal and Marginal Farmers to Farm Mechanisation More than 1200 nos. Agro Service Centers have been Established in the State. Normally small/marginal farmers are benefited by custom hiring of the Implement /machinery available at Agro service centre. More over SF & MF are major benefactors of mannual and bullock drawn farm equipments. Ample of subsidy extended to small and marginal farmers for farm mechanisation.
Energy and Farm Power Contd Strtegy to improve energy efficiency in farm Operation Ergonomic aspect is being taken in to consideration while designing Manual/ Bullock drawn implements. Special energy feeders are being set up in different places to supply un interrupted power to Agriculture and fishery sector. Strategy to improve agricultural Mechanisation More fund is being made available from State plan Schemes over and above the GoI allocation. Subsidy for different Agriculture implements/machinery has been increased. Subsidy up to 75% of the cost being extended in case of specific implements/ Machineries. Demonstrations and trainings are conducted in large scale Special training on repair and maintenance of farm machineries and equipments especially to un-employed youths.
Agriculture Infrastructure Availability of Storage and Processing Facility Storage- Storage space of 4, 03, 200 sq. ft. to store 20160 Tonnes of Seed. The capacity has been enhanced through construction of another 17 godowns under assistance from Central Plan. Dehumidified chmbers having capacity to store 500 MT of seeds has been established. PACSs/LMAP godowns store seeds for sale during the sowing season. The storage space of SWC & CWC and from private owners are hired during peak periods. Processing State has 153 functional seed processing plants with a capacity to process 341.83 TPH (96 Govt. & Public Sector +57 nos. Pvt. Sector) 28 nos. of Seed Processing plants have been repaired to enhance the processing capacity. Mobile seed processing plants with processing capacity of 2 TPH have been engaged. For uninterrupted operation during peak seasons gensets have been installed in some of the Plants.
Agriculture Infrastructure Contd.. Market Network established- 65 RMCs spreading across 55 revenue subdivisions 9 specialised cotton marketing yards 108 Cattle Market Yards under 39 RMCs. 43 Krushak Bazars for marketing of fruits and vegetables. Two Maize Mandis (Umerkote, Raighar) and two Cotton mandies (pralakhemundi, Berhampur). A mobile Grading Laboratory to facilitate paddy procurement. AGMARKNET nodes have been established in 91 markets. OAPM Act amended in June 2006 to encourage establishment of private market and contract farming. 37 market yards are being established with assistance under 13th Finance Commission Grant GoO has issued license to NCDEX Spot (electronic Spot exchange in India) to take up e-trading of maize, cotton, pulses and ginger.
Agriculture Infrastructure Contd.. Soil Testing facilities in Odisha Period Status of Soil Testing Facility Annual Capacity for testing Remarks Before 11th Plan 11 static STLs 120000 During 11th Plan 6 Static STLs & 6Mobile STLs established and existing Labs upgraded 130000 6 STLs - 60000 6MSTLs - 30000 Upgraded STLs- 40000 Soil Testing by Private Sector 15000 During 12th Plan 10 Static STLs under progress 100000 3 Static STLs proposed 30000 Total 395000 OUAT is extending soil testing facilities at Bhubaneswar & at 9 KVKs. Fertiliser companies have 2 static and one mibile STLs
New Initiatives for Soil Testing Setting up additional 13 Static Labs by Agril Deptt (All 30 districts will be covered with Static Soil Testing Labs) Setting up 34 Static Labs by Co-operation Deptt (These Labs to be Operated at PACS Level) Setting up of 5 Additional Mobile Soil Testing Units All Static Labs have been equipped with Atomic Absorption Spectrometer (AAS) for micronutrient testing These laboratories taken together will enhance the Soil Testing Facilities by 3 Fold
Agriculture Infrastructure Contd.. Fertiliser quality Control Facilities- The state has three FQCLabs at Berhampur, Sambalpur and Rayagada with a total capacity to test 10000 samples per annum. Another FQCL is under progress with testing capacity of 4000 samples annually. One Bio-fertiliser Testing Laboratory with a capacity to test 500 samples annually has been commissioned.
Agriculture Infrastructure Contd.. Private investment in agriculture Infrastructure- Cold storage cold chains have been established. Udyan Fresh an marketing endeavour in PPP mode for marketing of vegetables and fruits. (12 outlets have been established) 57 seed processing plants in private sector. Godown spaces have been established by private entrepreneurs are often leased in for public purposes.
Agriculture Infrastructure Contd.. Facilities for providing inputs to farmers. Inputs godowns are spread across the state up to block level for storing agri-inputs. Seed Godowns, Godowns in the FIAC buildings PACSs /LAMPs godowns are also utilised for storing agri-iputs
Agriculture Infrastructure Contd.. Scope and opprtunities to improve Godowns need to be established at GP level to house agri inputs to facilitate availability at the farmers door step. More of assistance to be provided for establishment of dehumidified storages.
Agro advisory network OUAT is the first SAU in the country to launch Agro-Met website since 2001. Research and Development Organisations OUAT (SAU), Bhubaneswar CRRI (Central Rice Research Institute), Cuttack CIFA (Central Institute for Freshwater Aquaculture), Bhubaneswar CTCRI (Central Tuber Crop Research Institute), Bhubaneswar DoWM (Directorate of Water Management), Bhubaneswar DRWA (Directorate of Research for Women in Agriculture), Bhubaneswar CHES (Central Horticulture Experimentation Station), Bhubaneswar CSWCRI (Central Soil & Water Conservation Research Institute) Koraput IRRI Hub for Odisha , Cuttack RPRC (Regional Plant Resources Center), Bhubaneswar
Performance of KVKs and ATMAs Krishi Vigyan Kendras There are 33 KVKs operating in he state primarily engaged in On-farm Testing, Frontline Demonstrations & Training. Items No.s. conducted No. of beneficiary On-farm Testing 443 2648 Frontline demonstration 584 4819 Trainings 2285 51660
Performance of ATMA In all the 314 blocks Block Technology Teams and Farmers Advisory Committee have been formed. 314 Block Technology Manager (BTM) & 628 Block Level Technical Assistants (BLTA) have been engaged. 12468 Farmer Friends @ 2/per GP have been identified. During 2013-14 10000 acres with proper marketing tie-up. Promoting HYV scented rice (Kudrat & Pravat) Massive Seed Treatment Capaig @ 10000 hectares in each Block Promoting soil testing @ 10 samples per village. Exposure visit of 215 Extension Officers & 1000 farmers outside the state. Organising 642 Farm Schools Training of 300 newly recruited Asst. Agricultural Officers.
Extent of services of Research & extension agencies used in Agriculture Development KVKs act as a member both in ATMA Governing Board & ATMA management Committee One of the Subject Matter Specialists of KVK acts as DPD (technical) of ATMA. KVKs also provides technical support to various flagship programmes being implemented. Res.-Extension-Farmer linkage is being strengthened through various programmes. Transfer of technology is being done through Capacity building programmes. Other NGOs/ Organisations/ Technical support Institutions working in the field of agriculture development are being involved as partners in the development process.
Extent of information on improved input and technology shared to the farming community. Disemination of such information is being done through various mass media, providing quality input and input assistance, conducting demonstrations and trials, organising Farmer Field schools, Farmers Training, Exposure visits and other capacity building programmes. Incentivising technology adoptions and farmers recognition Free mobiles with access to market information to all farmers (5000 have been supplied in the first phase).
Scope for improving information and technology disemination A lot of technology having potential to improve the pace of development in agriculture still remains unexploited. Development in agriculture has become very competitive in the post globalisation era. Technology need to be constantly upgraded and transfered for results as continuous process. Interactive portals/infromation kiosks need to be established . There need to be simulated pictorial programmes on technology which can solve the language barrier. Technology Parks need to be established with state of the art technologies employed.
Credit & Insurance Credit Flow to Agriculture Sector 2009-10 - 2010-11 - 2011-12 - 2012-13 - 2013-14 - (Coop. + Com. Banks) `5533.58 crores `6574.94 crores `5710.82 crores `10454.14 crores `7000.00 crores (Prog. For Coop. Sector) Access to Kissan Credit Card Total number of active KCC Cooperative Comm. /RRBs TOTAL Crop Insurance- (Number of farmers covered under NAIS, MNAIS, WBCIS) 2010-11 - 1258554 2011-12 - 1639989 2012-13 - 1584511 Crops covered Paddy, Groundnut, Maize, Arhar, Cotton, Patato, Mustard, Turmeric, Ginger - - - 41.58 lakh 13.41 lakh 54.99 lakhs
Scope and opportunities to improve credit flows to small and marginal farmers The small and marginal farmers are being extended interest subvention. (3% subsidy on interest for timely repayment) The scale of finance being revised suitably. Self help groups of tennant farmers or oral lesees are being extended crop loans Co-op. credit structure is being revamped. Universal coverage by Kissan Credit Cards to ensure flexibility in lending norms.
Human Resource Availability of human resource is adequate The PRIs respond well and are well aquainted with Agriculture sector Programmes. They are involved from planning level to implementation. Training Institutes- Institute of Management on Extension (IMAGE) 3 Regional Institute of Training on Extension 3 Training Institutes of Horticulture Minor Irrigation and Water use Training Institute Water and Land Management Training Institute OUAT has a Agriculture Technology Infoirmation Center that caters to training. Resouce persons/ Instructors are either available or outsourced from other institutions/ organisations for capacity building. KVKs FIAC s at Block level. Krushak Chetna Kendra in Watershed Areas Strategies for improvement Estabishement of Agri-polytechnics Establishment of Farmer Training Centers at District Levels