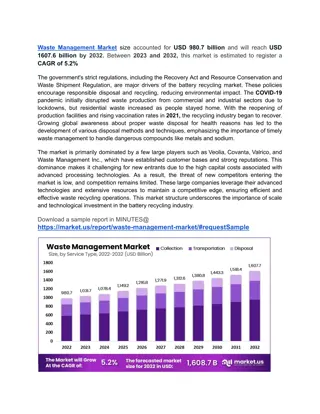
Waste Hauling Cost Structure and Reduction Strategies
This case study analyzes waste hauling cost structures, business approaches to waste reduction, and strategies for reducing overall waste expenditure. It includes detailed information on information collection methods, waste spend summaries, and audit components.
Download Presentation

Please find below an Image/Link to download the presentation.
The content on the website is provided AS IS for your information and personal use only. It may not be sold, licensed, or shared on other websites without obtaining consent from the author.If you encounter any issues during the download, it is possible that the publisher has removed the file from their server.
You are allowed to download the files provided on this website for personal or commercial use, subject to the condition that they are used lawfully. All files are the property of their respective owners.
The content on the website is provided AS IS for your information and personal use only. It may not be sold, licensed, or shared on other websites without obtaining consent from the author.
E N D
Presentation Transcript
Case Study: C&D as an Asset
Background Information 1) Waste hauling cost structure 2) Curiosity assessment 3) Competition 4) Marketplace practices Business Approach to Waste Reduction 1) Fix the cost 2) Modify practices LEAN approach don t reinvent the wheel 3) Engage Stakeholders (subcontractors, accountants, ops) Information Collection 1) Requested pricing for waste management services for DC Metro locations 2) Collected waste hauling billings from all office to determine yearly expenditures 3) Audited LEED project waste management records due to the access of complete information 4) Analyzed date to determine themes and improvement areas 5) Identified targeted savings areas based on economics and ease of deployment 6) Solicited field input regarding waste management related issues primary concern is cost and service
Waste Spend Summary YR 2011 YR 2012 Waste Spend Variance of 10% $1,278,989 $127,899 $1,406,888 4,138 $1,546,809 $154,681 $1,701,490 4,861 Total Ave. number of Dumpster Pulls HITT Total Revenue $976,000,000 $822,000,000 Note that while revenue was down from the previous year, waste spend was up. Waste Spend by Office 1200000 1000000 800000 600000 2011 400000 2012 200000 0
HQ Waste Spend Note that while revenue was down from the previous year, waste spend was up. Cost increase? Average cost per pull was $340/$341 Heavier debris? More Waste on Projects? Types of Projects? Does not include waste hauling associated with subs.
Audit Components dirt trash Total waste 32.51 234.10 logged # of Pulls # of Pulls Based on Weight # of pulls under 3.5 tons 74 47 49 Project Tons of Material Total Hauling Cost logged # of Pulls $ 40.09 6.80 120.01 17.00 # of Pulls Based on Weight Charges 25,728.41 $ EAI billed # Cost based on weight $ Overage 11,369.42 $ ESI Actual ESI # pulls # of pulls under 3.5 tons Deltek metal cardboard concrete/aggregrate/fines drywall plastic wood masonry carpet ceiling tile salvaged for reuse materials dirt trash Total waste - 74 47 0 14,358.99 49 metal cardboard concrete/aggreg rate/fines 17.69 EAI was the hauler. Audit allowable billings based on weight shows a 44% OVERAGE. drywall wood trash 32.51 234.10 Cost based on weight $ Charges 25,728.41 $ Overage 11,369.42 $ 14,358.99
Audit Finding 12 projects audited with a total of 526 pulls Audit uncovered weights less than 3 tons in 376 of cases Pull dates suggested fix day per week pulls and hauling air Pull costs associated with loads over 5 tons were found in 50 cases Bottom-line is that we are spending too much on waste hauling
Suggested Actions 1) Fix the cost Single Source Hauling Total Spend SS 2011/2012 Spend Projected savings $285 $285 $652,650 778,857 ($126,207) 880,073 1,053,000 ($172,927) $ $ 2) Reduce consumption Resource conservation Behavioral changes Behaviorial Change Just in time pull scheduling $ (65,264) Audit uncovered volumes less than 30 cyds Reduce rework eliminate 10% of needed pulls 229 Waste Avoidance in the Supply Chain Drywall MUST be recycled Reduce packaging materials Pallets must be returned Waste Factor Reduction eliminate 10% of needed pulls $ (65,264) 229
Start 8/1 contract renegotiation Accountants check vendor invoices for charges + goals for the next year. Corporate Report: Quarterly Report: Cost savings and recycling results IDS Satisfaction Survey Implementation Workflow Announcement to corporate via PM meetings, field meetings and web All projects starting August 1st All current projects with IDS servicing will have rate change Smaller tenant projects that cannot drop a dumpster are exempt Accountants check invoices for appropriate charges Waste hauling report to be provided to exec committee quarterly ALL dispatch issues in the field to be brought to KP immediately
Benefit Summary Savings in excess of $200K/YR Partner with best value in town Maintain environmental leader status Reduces waste and promotes resource efficiency Leverage as a LEAN practice Creative way to create a competitive edge Contributes to green building rating system credits
Questions? Kimberly Ann Pexton kimpexton@all-kaps.com 202.308.4190
