Waste Management Challenges Addressed Through Livestock Population Analysis
Explore the impact of livestock waste on available space and the equivalent human population in various regions. Gain insights from studies using USDA data and livestock models for better waste management strategies.

Download Presentation

Please find below an Image/Link to download the presentation.
The content on the website is provided AS IS for your information and personal use only. It may not be sold, licensed, or shared on other websites without obtaining consent from the author. If you encounter any issues during the download, it is possible that the publisher has removed the file from their server.
You are allowed to download the files provided on this website for personal or commercial use, subject to the condition that they are used lawfully. All files are the property of their respective owners.
The content on the website is provided AS IS for your information and personal use only. It may not be sold, licensed, or shared on other websites without obtaining consent from the author.
E N D
Presentation Transcript
Too Much Waste for Available Space? Murray Borrello and Chelsea Faber Alma College, Alma, MI 48801 A
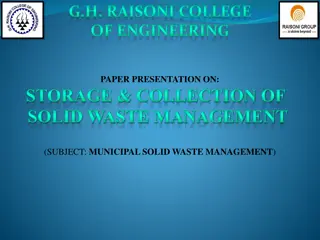
Livestock -Human Equivalent Population
4,000,000 3,522,683 3,500,000 3,000,000 2,500,000 Population 2,096,036 2,000,000 1,453,227 1,384,216 1,500,000 1,323,561 1,000,000 500,000 116,447 51,381 31,280 41,098 11,188 - Allegan Huron Livestock Equivalent Ionia Human Population Cass Gratiot Livestock- Human Equivalent Analysis
Iowa Study Chris Jones Using USDA Census of Agriculture data and livestock/human waste models to establish relative populations within a watershed Main point: if all waste created in Iowa was created by humans and not humans + livestock, how many people would that equate to? https://www.iihr.uiowa.edu/cjones /iowas-real-population/
Livestock Data from Midwest Plan Service https://www.canr.msu.edu/uploads/files/ManureCharacteristicsMWPS-18_1.pdf
Human Data from Iowa/Jones Study http://agrienvarchive.ca/bioenergy/facts.html#Approximate_nutrient_content
Sorted by County Calculated for each county that had a CAFO (42 total) Livestock - Human Equivalent Population Separated into: CAFO/AFO Non CAFO/AFO All farms Compared to 2017 human population 2017 used due to USDA Ag Census data
Livestock - Human Equivalent Calculation: Dairy Nitrogen 24,675 ?? 260 ? ? 9.1 ? ?= 705,000 ?????? Phosphorus 24,675 ?? 55 ? ? 1.8 ? ?= 753,958 ?????? Total Solids 24,675 ?? 7100 ? ?????? 160 ? ??????= 1,095,953 ?????? Average of these three values results in total dairy equivalent population
Livestock - Human Equivalent Population Dairy Eq.+ Beef Eq.+ Swine Eq.+ Layer Eq. = Total Livestock Equivalent
Livestock - Human Equivalent Population Dairy Eq.+ Beef Eq.+ Swine Eq.+ Layer Eq. = Total Livestock Equivalent
Livestock - Human Equivalent Population Dairy Eq.+ Beef Eq.+ Swine Eq.+ Layer Eq. = Total Livestock Equivalent
Quantity of Waste and Nutrients Produced
Quantity of Waste and Nutrients Produced Used MWPS conversion factors and USDA Census of Agriculture (2017) statistics Found mass of waste produced per county: in lbs/year and converted to kg/year
Volume of Nutrients Calculation - Dairy Total Solids: 20328 ?? 14.3 ???/??? 365 ???? 1 ???? = 106,101,996 ???/???? 1 ?? Total Nitrogen 20328 ?? 0.72 ???/??? 365 ???? 1 ???? = 5,342,198 ???/???? 1 ?? Total Phosphorus 20328 ?? 0.37 ???/??? 365 ???? 1 ???? = 2,745,296 ???/???? 1 ??
Application Rates
Application Rates Found kg/acre year and lbs/acre year through MRA data (USDA) Considering Phosphorus: Land available (Manure Acres USDA Census of Agriculture) Phosphorus removed from soil upon harvest (MSU Report) County average yield (USDA 2017) Corn Soybeans Wheat Sugar Beets
Application Rate Calculation County Avg yield P Removed = Rec Amount/Acre Total P /ManureAcre Reccommended Amount/Acre= Percent Over/Under
Phosphorus Application Rates: Corn RED RED: Counties in which Total Phosphorus from CAFO waste is applied to fields in tonnage of 150% (and up) more than what is required for corn Green Green: Counties in which Total Phosphorus from CAFO waste is applied to fields in tonnage less than 150% of what is required for corn
County Comparison Allegan Allegan Gratiot Gratiot Clare Clare Ogemaw Ogemaw Tuscola Tuscola Percent MRA 5% 9% 1% 3% 7% MRA (Acres) 30,845 32,116 5,340 9,948 38,057 Total P (lbs/yr) 9,994,655 4,479,174 525,796 1,138,642 2,190,668 % P Applied v P Required 494% 244% 184% 231% 98% (100% is a 1:1 Application Ratio)