Water Conservation and Demand Management Strategies
Explore Ekurhuleni Metropolitan Municipality's comprehensive approach to water conservation and demand management, focusing on initiatives, milestones, budget allocation, and achievements in reducing non-revenue water. Learn about the strategic plans and actions aimed at sustainable water resource management.
Download Presentation

Please find below an Image/Link to download the presentation.
The content on the website is provided AS IS for your information and personal use only. It may not be sold, licensed, or shared on other websites without obtaining consent from the author. If you encounter any issues during the download, it is possible that the publisher has removed the file from their server.
You are allowed to download the files provided on this website for personal or commercial use, subject to the condition that they are used lawfully. All files are the property of their respective owners.
The content on the website is provided AS IS for your information and personal use only. It may not be sold, licensed, or shared on other websites without obtaining consent from the author.
E N D
Presentation Transcript
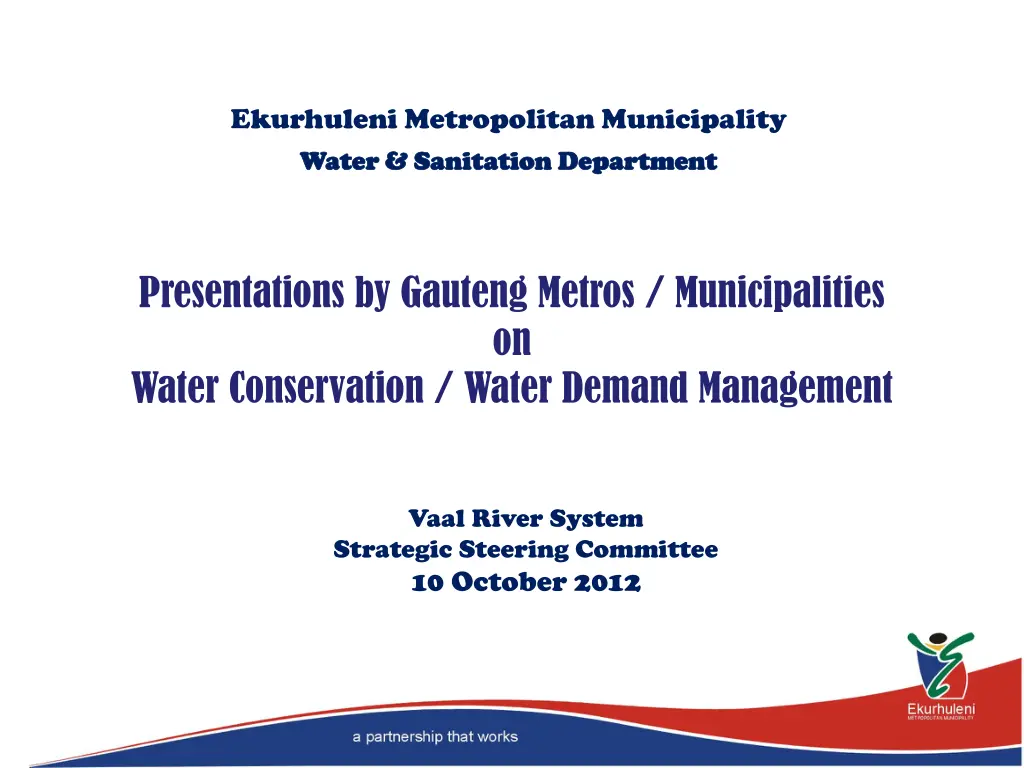
Ekurhuleni Metropolitan Municipality Water & Sanitation Department Water & Sanitation Department Presentations by Gauteng Metros / Municipalities on Water Conservation / Water Demand Management Vaal River System Strategic Steering Committee 10 October 2012
Presentation Outline BUSINESS PLAN Turn-Around Strategy / Action Plans NRW Reduction Milestones Potential Savings over 10 years Quantification of NRW components BUDGET ALLOCATION FOR WC/WDM To address Real losses / Technical Losses To address Apparent Losses / Commercial Losses PLANNING OF PROJECTS Real Loss Management Apparent Loss Management CURRENT PROJECTS Top 7 WDM Projects Photo s of Typical Water Loss Contributors ACHIEVEMENTS Update: DWA Project 15% Target NRW Status Recent Successes (Top 500, Jo burg Meters,) Cost / Benefit of Intervention Programme
Turn-Around Strategy /Action Plans The following WDM Initiatives have been prioritized: 1) WC/WDM Steering Committee fully functional collective decision making 2) Replacement of mid-block mains 3) Pipeline upgrading programme 4) Pro-Active leak detection and Repair 5) Discretization of water supply zones 6) Control Valves and Pressure Management 7) Telemetry System Early warnings 8) Cathodic Protection of Steel pipelines 9) Indigent (48 038 stands) and other leak repair projects 10) Top 500 Consumers 250 already done 11) Metering of Council properties 12) Replacement of Jo burg supply meters completed June 2012 13) Replacement of ageing large meters (meters > 20 years old) 14) Replacement of ageing domestic meters (meters > 25 years old) 15) Metering of Informal Settlements 16) Metering of all unmetered stands in Ekurhuleni 17) Metering of Institutions and Industries
NRW Reduction: Annual Milestones The Table below shows the targeted annual NRW reduction from 39.3% to 20% The average reduction over the 10 year period is 1.93% per annum = 6,537,735 kiloliter / annum = R33.1 million / annum Anticipated NRW Reduction over a 10 Year period 0 1 2 3 4 5 6 7 8 9 10 YEAR Current 2012/13 2013/14 2014/15 2015/16 2016/17 2017/18 2018/19 2019/20 20120/21 2021/22 Targeted Reduction: NRW Value: 0.0% 1.0% 1.7% 2.2% 2.4% 2.4% 2.4% 2.4% 2.2% 1.6% 1.0% 39.3% 38.3% 36.6% 34.4% 32.0% 29.6% 27.2% 24.8% 22.6% 21.0% 20.0%
NRW Reduction & Potential Savings over a 10 Year Period The Table below reflects the total estimated savings in water purchases over a 10 year period of 360,761,011 kiloliters during the NRW reduction programme. The corresponding saving in monetary terms is R1,825 billion. Reduction in NRW over 10 years 2,000,000,000 R 1,825,475,215 Kiloliter Savings 1,800,000,000 1,600,000,000 NRW Reduction (Rand) 1,400,000,000 1,200,000,000 1,000,000,000 800,000,000 600,000,000 360,761,011 kiloliter 400,000,000 200,000,000 0 1 2 3 4 5 6 7 8 9 10
EMM Status Quo of IWA Water Balance REAL LOSSES (Physical / Technical losses) 16.2% 54,876,325 kiloliters R278 million / annum Water pipe leaks Erf connection leaks Leaking meters Pipe bursts Overflowing reservoirs Leaks on unmetered properties Water Losses 30.7% APPARENT LOSSES (Commercial losses) 14.5% 49,117,699 kiloliters R249 million / annum Billing inaccuracies Interim readings Under-reading meters Illegal connections NRW 39.3% UNBILLED AUTHORIZED 8.6% 29,131,876 kiloliters R147 million per annum Informal settlement supply Unmetered properties Parks, sports fields, etc
Proportional Breakdown of Targeted NRW Reduction Analysis of NRW Main Categories of NRW Current % Description Descriptions Current NRW Desireable NRW Targeted Reduction * Waterpipe leaks * Erf connection leaks * Leaking meters * Pipe bursts * Overflowing reservoirs * Leaks on properties * Billing inaccuracies * Interim readings * Under-reading meters * Illegal connections Unbilled authorised: * Informal Settlements * 156 000 unmetered properties * Parks, sportfields, etc REAL LOSSES (Physical / Technical Losses) 16.2% 10.0% 6.2% Water Losses 30,7% APPARENT LOSSES (Commercial Losses) 14.5% 5.0% 9.5% Unbilled Authorised Consumption Unbilled Authorised 8,6% 8.6% 5.0% 3.6% 39,3% 39.3% 20.0% 19.3%
Estimated Funding Requirements WDM Water Projects (Technical Losses) Budget Requirements (Rand) --- First 5 Years & 10 Year Total No Project Description 10 YEAR TOTAL 2011/12 2012/13 2013/14 2014/15 2015/16 164,000,000 1 Replacement of Mid-Block Mains 18,000,000 19,100,000 12,200,000 8,000,000 3,000,000 380,000,000 2 Pipeline Upgrading 30,000,000 38,800,000 46,000,000 70,000,000 50,000,000 15,000,000 Pro-Active Leak Detection - 1,400,000 1,900,000 1,500,000 1,500,000 10,000,000 Valve & Fittings Audit - 2,000,000 2,000,000 2,000,000 1,000,000 3 Leak Repair Projects - 15,000,000 25,000,000 21,000,000 20,000,000 110,000,000 Control Valves & Pressure Management 12,000,000 4 - 3,000,000 2,000,000 2,000,000 1,000,000 5 Indigent Leak Fixing 5,000,000 6,000,000 6,000,000 6,000,000 5,000,000 35,000,000 35,000,000 6 Cathodic Protection of Steel Pipes - 4,500,000 6,000,000 6,000,000 6,000,000 Telemetry Bulk Meters, Reservoirs, Water Towers including Security of Sites 7 - 1,000,000 5,000,000 4,000,000 4,000,000 17,000,000 Discretization of Water Supply Zones - 400,000 1,200,000 1,600,000 1,600,000 6,000,000 8 Management of District Metered Areas 6,000,000 - 1,000,000 1,000,000 1,000,000 500,000 TOTALS: 53,000,000 91,200,000 107,300,000 122,100,000 93,100,000 784,000,000 53,000,000 144,200,000 251,500,000 373,600,000 466,700,000 784,000,000 ACCUMULATIVE TOTALS: 5 Year Total 10 Year Total Year 1 Year 2 Year 3 Year 4
Estimated Funding Requirements WDM Water Projects (Commercial Losses) Budget Requirements (Rand) --- First 5 Years & Total Requirement Total Cost of project or cost per annum * No Project Description 2011/12 2012/13 2013/14 2014/15 2015/16 Domestic meters - Backlog Replacement (40 000 stands) Domestic meters - Replace meters every 15 years (30 000/annum) Domestic Meters - Normal annual replacement-2,5% (11 000/annum) Domestic Meters-Special Project Metering of unmetered stands (88 000) Domestic Meters - Special Project Relocate meters to outside of erf boundaries (27 400) Large meters - Backlog Replacement (24 000) Large meters - Replace meters every 10 years (2400/annum) Large meters - Normal annual replacement - 2,5% (600/annum) Metering of Informal Settlements (119) 1 12,000,000 12,000,000 14,000,000 - 38,000,000 * 20,000,000 30,000,000 30,000,000 30,000,000 30,000,000 30,000,000 * 10,500,000 10,500,000 10,500,000 10,500,000 10,500,000 10,500,000 2 - - 19,000,000 19,000,000 23,000,000 84,000,000 - - 8,500,000 8,500,000 9,000,00 26,000,000 3 - - 60,000,000 65,000,000 70,000,000 1 200,000,000 * - - 105,000,000 105,000,000 105,000,000 105,000,000 * - - 26,000,000 26,000,000 26,000,000 26,000,000 4 - 6,000,000 - - - 6,000,000
Estimated Funding Requirements WDM Water Projects (Commercial Losses) Budget Requirements (Rand) --- First 5 Years & Total Requirement Total Cost of project or cost per annum * No Project Description 2011/12 2012/13 2013/14 2014/15 2015/16 Large meters-Special Project Replacement of bulk meters supply to Johannesburg (8) Large meters-Special Project Replace meters of top 500 consumers (500) Large meters-Special Project Replace meters of all Schools (540) Large meters-Special Project Replace meters in Wadeville (560) Large meters-Special Project Replacement of all meter of EMM Properties (2000) 5 500,000 - - - - 500,000 6 16,500,000 12,500,000 13,000,000 8,000,000 - 50,000,000 7 - 10,000,000 12,000,000 12,500,000 - 34,500,000 - 10,000,000 20,000,000 29,000,000 - 59,000,000 8 - - 20,000,000 25,000,000 25,000,000 120,000,000 TOTALS: 47,500,000 91,000,000 336,000,000 352,500,000 298,500,000 1 618,000,000 Plus ACCUMULATIVE TOTALS: 47,500,000 138,000,000 474,500,000 827,000,000 1 125,500,000 171,500,000/annum 5 Year Total Year 1 Year 2 Year 3 Year 4
Real / Technical Loss Management Pro-Active leak detection project Faster turnaround times to service failures Rehabilitating infrastructure & prioritization of projects 14,211 cases of water breaks Contractors damaging our pipes & water theft Germiston: replace water mains project Management of leaks in schools & indigent households Informal settlements management Management of consumption at taxi ranks Cathodic protection Management of hostels Pressure management & maintenance of control valves especially PRVs Real Losses 16.2% Management of Council properties such as cemeteries & parks Minimise Water theft
Apparent / Commercial Loss Management Eradicate illegal connections Wadeville special project Metering of all unmetered properties Consumer education & awareness campaign Application of credit control policy & reduce interims Apparent / Commercial Losses 14.5% Top 500 consumer project Tsakane, Langaville & Geluksdal leak repair project Under-reading meters due to them ageing (>20 years old). Meter replacement programme.
Top7 WDM Projects 1) Replacement of Mid-Block Water Pipelines (R164 million over 10 years) Mid-block mains remain a problem, and is one of the biggest contributors towards water losses. Ekurhuleni has a definite plan to eradicate the mid-blocks pipelines over the next 5 years. R44,3m has been budgeted over the next 3 years for this purpose. Complete Project funding needs: Available funding: Project Description Amount in 2012-2015 FY Expected Completio n date Area Amount Phomolong R 44 000 000 Daveyton R47 000 000 Relocate midblock water Daveyton (W55) C/F R100 000 31 September 2012 Tembisa R 25 000 000 Kwa-Thema: Upgrading of water network C/F R9 500 000 2012/06/30 Kwa-Thema R 16 000 000 Vosloorus R 20 000 000 Isolate Midblock water Kwa-Thema R5 700 000 2013/06/30 Thokoza R12 000 000 Mid-Block Water Lines Removal R29 000 000 01 June 2014 Total Amount = R164 000 000,00 TOTAL R 44 300 000
Top 7 WDM Projects (continued) 2) Pipeline Upgrading (R380 million over 10 years) The upgrading of municipal water mains is an ongoing pipeline rehabilitation process, and R113m has been budgeted over the next 3 years to attend to the older pipelines which have served their useful lifespan, and which are no longer economical to maintain. 3) Pressure Management (R12 million) Pressure management is regarded as a quick-win initiative to reduce water losses, and the setting up of pressure management zones in Ekurhuleni is well advanced. However, the strategic management of the installations needs to be outsourced until sufficient internal capacity has been created, together with the necessary mentoring & coaching. 4) Tsakane/Langaville/Geluksdal Leak Repair Project (41 000 stands R61 million) Based on the prioritization / sorting of zones from the highest to the lowest NRW, Tsakane/Langaville/Geluksdal was identified as the area within Ekurhuleni with the highest losses and therefore as the area with the biggest potential to reduce water losses.
Top 7 WDM Projects (Continued) 5) Top 500 Consumers (R50 million) To improve and consolidate the Top 500 consumers meters by June 2016. The Top 500 consumers represents approximately 10% of the total EMM water demand. 6) Bulk Meter Consumers (R1 200 million over 10 years) To audit and consolidate all bulk meter consumers (approximately 24 000 properties) by June 2022/2023 10 year programme. These meters are more than 20 years old, some older than 25 years, and should actually be replaced every 5 to 8 years depending on consumptions. The under-reading of meters is a huge contributor towards NRW. EMM buys water from Rand Water with meters operating at 98% accuracy, and EMM in turn sells the water with meters under-reading by at least 7% (estimated at 24,000,000 kiloliters pa) on average. EMM fits the bill (estimated at R171 million pa) for the City Wide estimated 7% input volume (due to under-reading) solely because the huge backlog in the meter replacement programme. 7) Replacement Of Aged Domestic Meters (R165 million over 10 years) Replacement of all aged domestic meters older than 20 years (approximately 112 000 currently under-reading consumptions by approximately 14%) by 2016.
Leaking Plumbing Fittings Leaking Toilet Cistern Leaking Tap Two major contributors towards water losses
COMPLIANCE WITH DWA PROJECT 15% TARGET 400,000,000 389,694,298 Ekurhuleni Bulk Water Purchase Projection A 378,530,000 377,845,008 380,000,000 B 365,995,718 364,594,304 A - E = 50,000,000 Kl B - D = 27,000,000 Kl C - E = 25,000,000 Kl C 360,000,000 351,370,000 Bulk Purchases (kl/annum) D 342,297,138 340,000,000 E 329,424,656 339,816,151 338,742,752 317,977,206 320,000,000 322,249,616 313,659,638 DWA Project 15% Status = 1,29% behind target (4,328,308 Kl) at 2011/2012 year end 300,000,000 288,375,444 282,970,013 280,000,000 Current Demand = 338,742,752 June 2012 (12 months rolling total) 272,540,781 260,000,000 2003/2004 272,540,781 282,970,013 288,375,444 313,659,638 317,977,206 329,424,656 342,297,138 355,835,162 365,995,718 377,845,008 389,694,298 271,930,000 276,640,000 287,840,000 299,500,000 311,630,000 324,250,000 337,380,000 351,050,000 365,270,000 371,840,000 378,530,000 271,930,000 271,080,000 278,480,000 286,290,000 294,510,000 303,170,000 312,960,000 325,450,000 339,160,000 345,210,000 351,370,000 272,540,781 282,970,013 288,375,444 313,659,638 317,977,206 329,424,656 332,297,138 334,159,794 335,995,718 337,845,008 339,694,298 272,540,781 282,970,013 288,375,444 313,659,638 317,977,186 328,769,346 322,249,616 332,555,664 338,742,752 2004/2005 2005/2006 2006/2007 2007/2008 2008/2009 2009/2010 2010/2011 2011/2012 2012/2013 2013/2014 Annual Projection 4.57% DWA Projection (No WDM) DWA Target (With WDM) Water Saving Target 3.12% Current Demand Year DWA Revised (With WDM) DWA Revised (No WDM) Average 322,249,616 329,445,530 334,414,444 337,083,684 339,816,151 322,249,616 336,408,889 349,626,369 358,201,163 364,594,304
NRW History System Input Volume Billed Authorised Consumption SDA NRW NRW System Input Volume (kl/annum) Billed Authorised Consumption (kl/annum) SDA NRW NRW % (kl/annum) (kl/annum) 31,432,964 43,967,596 44,601,148 27,880,296 73,202,976 (kl/annum) 18,605,800 25,598,536 28,051,802 7,487,935 45,948,724 (kl/annum) 12,827,164 18,369,060 16,549,346 20,392,361 27,254,252 % Alberton 40.8% Alberton Benoni Boksburg Brakpan Germiston 28,801,064 17,951,840 10,849,224 37.7% 41.8% 37.1% 73.1% 37.2% Benoni 41,325,300 24,693,671 16,631,629 40.2% Boksburg 43,135,049 28,127,695 15,007,354 34.8% Brakpan Kempton Park 25,195,630 54,339,368 6,626,649 38,438,696 18,568,981 15,900,672 73.7% 29.3% Germiston Lethabong Nigel Springs 72,231,104 12,212,980 11,416,576 33,501,760 43,624,550 9,883,726 7,731,300 22,649,886 28,606,554 2,329,254 3,685,276 10,851,874 39.6% 19.1% 32.3% 32.4% Kempton Park 56,017,654 34,802,110 21,215,544 37.9% Lethabong 11,487,960 9,180,821 2,307,139 20.1% Nigel Ekurhuleni (Jun 2012) 10,403,197 338,742,752 6,577,806 205,497,030 3,825,391 133,245,722 36.8% 39.3% Springs Ekurhuleni (Jun 2011) 34,224,789 332,555,664 22,388,256 204,396,405 11,836,533 128,159,259 34.6% 38.5% Ekurhuleni (Jun 2010) 322,821,747 193,973,397 128,848,350 39.9% Ekurhuleni (Jun 2009) 329,424,656 201,338,050 128,086,606 38.9%
Top 500 Consumers Attending to the Top 500 Consumers is one of the main current WDM Initiatives: These Consumers generate approximately 10% of overall income. 145 of the 500 have been successfully completed to date. The total saving achieved thus far is approximately 158,592 kiloliters per month. R9,6 million per year R96 million over 10 years Based on the first 145 meters completed, the average saving per property R10,438 per month. Therefore, for the Top 500 consumers, the projected savings are as follows: R62,6 million / annum R626 million over a 10 year period (These potential savings have been calculated at R5.06 / kiloliter) For the first 145 meters completed, the AADD prior to the intervention increased as follows: Prior AADD = 13,798 Kl / day Post AADD = 18,645 Kl / day Increased sales = 5,748 Kl / day = 35% increase in volume metered / sold Increase make-up = due to under reading, due to connections not on the billing system This undoubtedly proves the necessity and financial viability of replacing high volume This undoubtedly proves the necessity and financial viability of replacing high volume meters. meters. The backlog in refurbishing meters is therefore a huge contributor towards the high The backlog in refurbishing meters is therefore a huge contributor towards the high NRW figure. NRW figure. due to unmetered connections,
Replacement of Johannesburg Supply Meters The replacement of the eight supply meters to Johannesburg has been successfully completed: The average daily consumption during 2010 / 2011 was 10,787 Kl/day The average daily consumption during 2011 / 2012 was 14,698 Kl/day The increase in the volume sold to Jo burg Water was therefore 3,910 Kl/day: R0.6 million / month R7,2 million / annum R72 million over a 10 year period (These potential savings have been calculated at R5.06 / kiloliter) These bulk supply meters have been under These bulk supply meters have been under- -reading by 36% !!!!!!!! reading by 36% !!!!!!!! This undoubtedly proves the necessity and financial viability of replacing high This undoubtedly proves the necessity and financial viability of replacing high volume meters. volume meters. The backlog in refurbishing meters is therefore a huge contributor towards the The backlog in refurbishing meters is therefore a huge contributor towards the high NRW figure. high NRW figure.
Availability charges EMM is entitled to charge AVILABILITY CHARGES to owners of undeveloped properties, simply because services have already been provided by the Council, for which no payment is received: 11 579 Stands have been investigated 7 135 Properties can be charged The potential income to be derived from this intervention is as follows: R 722,100.00 / month for Water Availability Charge R 448,700.00 / month for Sewer Availability Charge R 1,170,800 / month million combined R14 million / annum R140 million over 10 years This undoubtedly proves the necessity and financial viability of these charges. This undoubtedly proves the necessity and financial viability of these charges.
Cost /Benefit of Intervention Programme Cost / Benefit of NRW Reduction Programme over 10 Years R 3,000,000,000 R 2,786,800,000 Intervention Cost (Including Backlog Eradication) R 2,500,000,000 NRW Intervention Savings R 2,000,000,000 R 1,825,475,215 R 1,500,000,000 R 1,000,000,000 R 500,000,000 R 0 1 2 3 4 5 6 7 8 9 10

