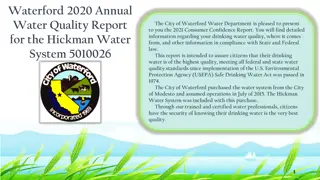
Waterford 2021 Annual Water Quality Report
This report provides detailed information on the water quality of the Waterford water system, including its sources and compliance with federal and state standards under the Safe Drinking Water Act. It also highlights water conservation tips and the city's efforts to reduce water usage.

Download Presentation

Please find below an Image/Link to download the presentation.
The content on the website is provided AS IS for your information and personal use only. It may not be sold, licensed, or shared on other websites without obtaining consent from the author.If you encounter any issues during the download, it is possible that the publisher has removed the file from their server.
You are allowed to download the files provided on this website for personal or commercial use, subject to the condition that they are used lawfully. All files are the property of their respective owners.
The content on the website is provided AS IS for your information and personal use only. It may not be sold, licensed, or shared on other websites without obtaining consent from the author.
E N D
Presentation Transcript
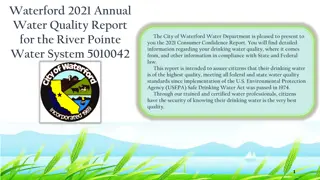
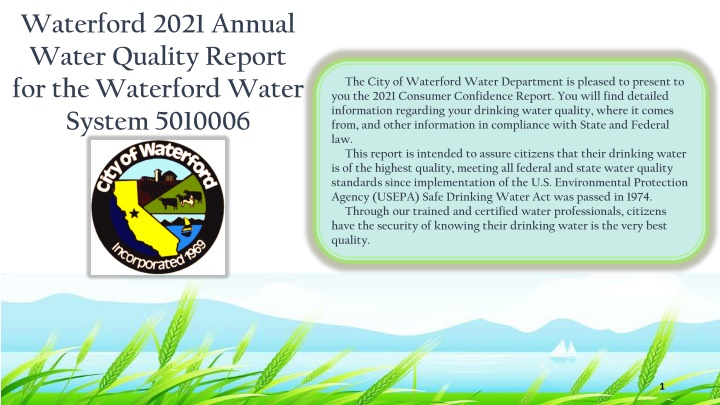
Waterford 2021 Annual Water Quality Report for the Waterford Water System 5010006 The City of Waterford Water Department is pleased to present to you the 2021 Consumer Confidence Report. You will find detailed information regarding your drinking water quality, where it comes from, and other information in compliance with State and Federal law. This report is intended to assure citizens that their drinking water is of the highest quality, meeting all federal and state water quality standards since implementation of the U.S. Environmental Protection Agency (USEPA) Safe Drinking Water Act was passed in 1974. Through our trained and certified water professionals, citizens have the security of knowing their drinking water is the very best quality. 1
Welcome Este informe contiene informaci n importante sobre su agua potable. Trad zcalo o hable con alguien que lo entienda bien. Para informaci n en espa ol, llame por favor al (209) 874-2328. The City of Waterford is pleased to provide you with water that meets the United States Environmental Protection Agency (USEPA) standards for safety. In accordance with the USEPA and California regulations under the Safe Drinking Water Act, water utilities are required to provide detailed water quality information to their consumers. Found in this report are water quality information. This report contains important information about your drinking water. If the report is not available in your native language, we encourage you to identify someone who understands it and can translate for you. City of Waterford Contact Information Mailing Address P.O. Box 199 Waterford, Ca. 95386 (209) 874-2328 2
Waterford Conservation Program The average U.S. household uses approximately 400 gallons of water per day or 100 gallons per person per day? Luckily, there are many low-cost and no-cost ways to conserve water. Small changes can make a big difference try one today and soon it will become second nature. Take short showers a 5 minutes shower uses 4 to 5 gallons of water compared to up to 50 gallons for a bath. Shut off water while brushing your teeth, washing your hair, and shaving and save up to 500 gallons a month. Use a water-efficient showerhead. They are inexpensive, easy to install, and can save you up to 750 gallons a month. Run your clothes washer and dishwasher only when they are full. You can save up to 1,000 gallons a month. Water plants only when necessary. Fix leaking toilets and faucets. Faucet washers are inexpensive and take only a few minutes to replace. To check your toilet for a leak, place a few drops of food coloring in the tank and wait. If it seeps into the toilet bowl without flushing, you have a leak. Fixing it or replacing it with a new, more efficient model can save up to 1,000 gallons a month. Adjust sprinklers so only your lawn is watered. Apply water only as fast as the soil can absorb it and during the cooler parts of the day to reduce evaporation. Teach your kids about water conservation to ensure a future generation that uses water wisely. Make it a family effort to reduce next month s water bill! Visit www.epa.gov/watersense for more information. Conservation goals are still underway. Senate Bill 7 (SB X7-7 of 2009) requires Urban and Agriculture to reduce water use 20% by 2021. The citizens of Waterford worked together and significantly reduced water usage by 20%. For ways to save visit: http://saveourwater.com/ 3
Sampling and Treatment Waterford relies solely on groundwater for the drinking water system. As water moves through the hydrological cycle, or water cycle, and through the earth to our aquifer it dissolves naturally-occurring minerals and, in some cases, radioactive material, and can pick up substances resulting from human activity. In order to ensure that tap water is safe to drink, the U.S. Environmental Protection Agency (USEPA) and the State Water Resources Control Board (SWRCB) prescribe regulations that limit the amount of certain contaminants in water provided by public water systems. The U.S. Food and Drug Administration regulations and California law also establish limits for contaminants in bottled water that provide the same protection for public health. Additional information on bottled water is available on the California Department of Public Health website (https://www.cdph.ca.gov/Programs/CEH/DFDCS/Pages/F DBPrograms/FoodSafetyProgram/Water.aspx). A Source Water Assessment is available. Please contact The City of Waterford for more information. 4
USEPA and the State Water Resources Control Board The State Water Resources Control Board requires us to inform you that: Drinking water, including bottled water, mat reasonably be expected to contain at least small amounts of some contaminants. The presence of contaminants does not necessarily indicate that the water poses a health risk. More information about contaminants and potential health effects can be obtained by calling the USEPA s Safe Drinking Water Hotline (1-800-426-4791). Some people may be more vulnerable to contaminants in drinking water than the general population. Immuno- compromised persons such as people with cancer undergoing chemotherapy, persons who have undergone organ transplants, people with HIV/AIDS or other immune system disorders, some elderly, and infants can be particularly at risk from infections. These people should seek advice about drinking water from their health care providers. USEPA/Centers for Disease Control (CDC) guidelines on appropriate means to lessen the risk of infection by Cryptosporidium and other microbial contaminants are available from the Safe Drinking Water Hotline (1-800-426- 4791). 5
ContaminantInformation Contaminants that may be in source water include: Microbial contaminants, such as viruses and bacteria that may come from sewage treatment plants, septic systems, agricultural livestock operations, and wildlife. Inorganic contaminants, such as salts and metals, which can be naturally Inorganic contaminants, such as salts and metals, which can be naturally-occurring occurring or result from urban storm water runoff, industrial or domestic wastewater or result from urban storm water runoff, industrial or domestic wastewater discharges, oil and gas production, mining, or farming. Pesticides and herbicides, which may come from a variety of sources such as agriculture, urban storm water runoff, and residential uses. Organic chemical contaminants, including synthetic and volatile organic chemicals, which are by-products of industrial processes and petroleum production, and can also come from gas stations, urban storm water runoff, agricultural application, and septic systems. Radioactive contaminants, that can be naturally be naturally-occurring or be the result of oil and gas production or mining activities. Nitrate in drinking water at levels above 10 mg/L is a health risk for infants of less than six months of age. Such nitrate levels in drinking water can interfere with the capacity of the infant s blood to carry oxygen, resulting in a serious illness; symptoms include shortness of breath and blueness of the skin. Nitrate levels above 10 mg/L may also affect the ability of the blood to carry oxygen in other individuals, such as pregnant women and those with certain specific enzyme deficiencies. If you are caring for an infant, or you are pregnant, you should ask advice from your health care provider. Nitrate levels may rise quickly for short periods of time because of rainfall or agricultural activity. 1,2,3-trichloropropane or TCP was an impurity in soil fumigants used from the 1950 s to the 1980 s, has been detected in some of the wells used to supply your drinking water. Prior to 2018 TCP was an unregulated contaminant. However, the State Water Resources Control Board adopted a new Maximum Contaminant Level (MCL) of 5 parts per trillion (ppt) for TCP that went into effect on January 1st of 2018. The average TCP level detected in the City water supply during the 2018 calendar year was 0.0 ppt. Some people who drink water containing TCP in excess of the MCL over many years may have an increased risk of getting cancer. 6
Water Quality Sampling The State allows us to monitor for some contaminants less than once per year because the concentrations of these contaminants do not change frequently. Some of our data, though representative, are more than one year old. On a monthly basis, City staff collect samples for contaminants as required by the State. For more detailed information, we have provided you with a table showing what types of contaminants have been tested, the results of those water samples, and the State MCLs (Maximum Contaminant Levels). The table below lists contaminants which: 1) have associated primary Maximum Contaminant Levels (MCLs) that are registered and 2) were detected by the City of Waterford's Water Services Division. Contaminants were detected below, at or above the Detection Limits for Purposes of Reporting (DLR) . The presence of these contaminants in the drinking water does not necessarily indicate that the water poses a health risk. More information about contaminants and potential health risks can be obtained by calling the U.S. Environmental Protection Agency (EPA) at (800) 426-4791 or visiting the agency's website at www.epa.gov/safewater.hfacts.html. California action levels are available on the State Water Resources Control Boards website www.waterboards.ca.gov. Table 1 lists all regulated contaminants with Primary MCLs that the City of Waterford s Water Services Division detected in the drinking water below, at or above the State DLR. Table 2 lists regulated contaminants with Secondary MCLs that were detected at or above the State DLR. Table 3 lists disinfection residuals and by-products that were detected in the treated water. DLR: detection limit for reporting mg/L: number of milligrams in one liter of water n/a: not applicable NTU: nephelometric turbidity units pCi/L: picocuries per liter (a measure of radiation) ppb: parts per billion ppm: parts per million ppt: parts per trillion TT: treatment technique S/cm: micro-siemens/cm >: Greater than <: less than LRAA: locational Running Annual Average The following tables on pages 8 - 11 contain detailed information showing what type of chemicals have been found in the water, the results, and the State Maximum Contaminate Levels (MCLs) 7
COMPARATIVE FIGURES FOR INTERPRETING DEFINITION OF TERMS Maximum Contaminant Level (MCL): The highest level of a contaminant that is allowed in drinking water. Primary MCLs are set as close to the PHGs (or MCLGs): as is economically and technologically feasible. Secondary MCLs are set to protect the odor, taste, and appearance of drinking water. Maximum Contaminant Level Goal (MCLG): The level of a contaminant in drinking water below which there is no known or expected risk to health. MCLGs are set by the U.S. Environmental Protection Agency. Public Health Goal (PHG): The level of a contaminant in drinking water below which there is no known or expected risk to health. PHGs are set by the California Environmental Protection Agency. Primary Drinking Water Standard (PDWS): MCLs and MRDLs for contaminants that affect health along with their monitoring and reporting requirements, and water treatment requirements. Maximum Residual Disinfectant Level (MRDL): The highest level of a disinfectant allowed in drinking water. There is convincing evidence that addition of a disinfectant is necessary for control of microbial contaminants. Maximum Residual Disinfectant Level Goal (MRDLG): The level of a drinking water disinfectant below which there is no known or expected risk to health. MRDLGs do not reflect the benefits of the use of disinfectants to control microbial contaminants. Regulatory Action Level: The concentration of a contaminant which, if exceeded, triggers treatment or other requirements that a water system must follow. Treatment Technique (TT): A required process intended to reduce the level of a contaminant in drinking water. Variances and Exemptions: State Board permission to exceed an MCL or not comply with a treatment technique under certain conditions. MEASUREMENTS WITHIN THIS REPORT 1 PPM 1 PPB 1 PPT 1 second in nearly 32 years 1 second in nearly 32,000 years 1 second in 11.5 days 1 penny out of $10,000 1 penny of $10,000,000 1 penny of $10,000,000,000 1 inch of 15,782.8 miles 1 inch of 657.6 trips around the equator 1 inch of 15.8 miles 1 minute in 19 centurys 1 minute in 1,900 millenniums 1 minute in 1.9 years 1 ounce in 62,500 pounds 1 ounce in 31,250 tons 1 ounce in 31,250,000 *SOURCE: AMERICAN WATER WORKS ASSOCIATION (AWWA) WEBSITE 8
TABLE 1 - DETECTED REGULATED CONTAMINANTS WITH MCL'S INORGANIC CONTAMINANTS YEAR SAMPLED CONTAMINANT UNITS MCL PHG DLR AVG RANGE VIOLATION TYPICAL SOURCE OF CONTAMINANTS Arsenic Simazine Atrazine Odor Ppb Ug/l Ug/l T.O.N. 10 .25 .25 3.0 0.004 1.0 1.0 8.0 2 3.55 0 0 8 2.42 3.04-4.23 0 0 0-8 2021 2021 2021 2021 No No No No Erosion of natural deposits; runoff from orchards; glass and electronics production wastes 1.00 1.00 3.00 Discharge from electroplating factories, leather tanneries, wood preservation, chemical synthesis, refractory production, and textile manufacturing facilities; erosion of natural deposits Hexavalent Chromium Calcium Magnesium Ppb 10 0.02 1 2.42 2018 No mg/l mg/l 0.0500 0.100 n/a n/a 1.00 1.00 33.5 21.8 0-50 0-50 2021 2021 No No 3.23 <50 4.63 0 <1 <1 <10 <20 <1 <1 <10 <5 Erosion of natural deposits; runoff/leaching from fertilizer use, septic tanks and sewage Nitrate Aluminum Antimony Barium Beryllium Cadmium Chromium Manganese Mercury Nickel Selenium Silver Zinc 1,2,3 Trichloropropane (TCP) Ppm Ug/l Ug/l Ug/l Ug/l Ug/l Ug/l Ug/l Ug/l Ug/l Ug/l Ug/l 10 10 n/a n/a n/a n/a n/a n/a n/a n/a n/a n/a n/a n/a .7 2 0.15-4.40 <50 0 100-103 <1 <1 <10 <20 <1 <10 <5 <1 2021 2020 2021 2020 2020 2020 2020 2021 2020 2020 2020 2020 No No No No No No No No No No No No 1000 0 1000 4 5 50 50 2 100 50 100 50 6 100 1.0 1.0 10.0 20.0 1.0 10.0 5.0 10.0 SYNTHETIC ORGANIC CHEMICALS/HERBICIDES AND PESTICIDES AVG RANGE YEAR SAMPLED CONTAMINIANT Dibromo- chloropropane (DBCP) UNITS MCL PHG DLR VIOLATION TYPICAL SOURCE OF CONTAMINANTS Banned nematocide that may still be present in soils due to runoff/leaching from former use on soybeans, cotton, vineyards, tomatoes and tree fruit ppt 0.2 0.0017 0.01 0.0120 0.01-0.12 2021 No ppt 5 5 0.0 0.0-1.00 2021 No Historical application of soil fumigants RADIOACTIVE CONTAMINANTS CONTAMINANT UNITS MCL PHG DLR AVG RANGE YEAR SAMPLED VIOLATION TYPICAL SOURCE OF CONTAMINANTS Uranium Erosion of natural deposits pCi/L 20 0.43 1 0.3 0-1.66 2013 No 9
TABLE 2 - DETECTED REGULATED CONTAMINANTS WITH SECONDARY MCL'S CONTAMINANT UNITS STANDARDS PHG DLR AVG RANGE YEAR SAMPLED VIOLATION TYPICAL SOURCE OF CONTAMINANTS Runoff and leaching from natural deposits; seawater influence Substances that form ions when in water; seawater influence Chloride ppm 500 n/a n/a 10.5 8.5-12.4 2020 No Specific Conductance uS/cm 1600 n/a n/a 331 331 2018 No Runoff/leaching from natural deposits; industrial wastes Sulfate ppm 500 n/a 0.5 16.9 16.9 2018 No Total Dissolved Solids Runoff/leaching from natural deposits ppm 1000 n/a n/a 251 251 2018 No ADDITIONAL INORGANIC CONTAINMINANTS RANGE YEAR SAMPLED 0-45.00 CONTAMINANT Hardness(as CaCO3) Sodium pH UNITS Ppm MCL 0.100 PHG n/a DLR 0.100 AVG 33.5 VIOLATION No TYPICAL SOURCE OF CONTAMINANTS Hardness is the sum of polyvalent cations present in the water, generally magnesium and calcium. The cations are usually naturally occurring. n/a 2021 mg/l Units 2.00 n/a n/a 16.7 0-25 2021 No n/a n/a n/a 7.65 7.6-7.7 2020 No No No No No No Total Alkalinity Hydroxide Carbonate Bicarbonate Sulfate Fluoride Turbidity MBAS n/a 2021 2021 2021 2021 2021 Ppm mg/l mg/l mg/l mg/l mg/l mg/l NTU n/a n/a 5.0 n/a n/a 500 2 5 n/a n/a n/a n/a n/a n/a n/a n/a n/a n/a n/a n/a n/a 0.5 0.1 0.1 13.2 290 ND ND 290 11.1 0.12 0.1 17.8-18.6 AT THE TAP CONTAMINANTS 90TH% CONCENTRATION #SAMPLE > ACTION LIMITS CONTAMINANT UNITS ACTION LEVEL PHG DLR # OF SAMPLES YEAR SAMPLED TYPICAL SOURCE OF CONTAMINANTS Internal corrosion of household plumbing systems; erosion of natural deposits; leaching from wood preservatives Internal corrosion of household water plumbing systems; discharges from industrial manufacturers; erosion of natural deposits Copper ppm 1.3 0.3 0.05 28 0.643 2020 0 Lead ppb 15 0.2 5 28 ND 2020 0 10
BACTERIOLOGIAL CONTAMINANTs CONTAMINANT UNITS MCL PHG DLR AVG RANGE YEAR SAMPLED VIOLATION TYPICAL SOURCE OF CONTAMINANTS n/a Heterotrophic Plate Count cfu/ml n/a n/a n/a 2.18 0-20 2021 No BACTERIOLOGIAL CONTAMINANTs CONTAMINANT Total Coliform Bacteria UNITS MCL PHG DLR Highest Month YEAR SAMPLED VIOLATION TYPICAL SOURCE OF CONTAMINANTS Naturally present in the environment Present / Absent >5.0% per month 0 n/a 0% 2021 No TABLE 3 - DETECTED DISINFECTION BY-PRODUCTS AND DISINFECTION RESIDUAL DISINFECTANT RESIDUAL CONTAMINANT UNITS MCL PHG DLR AVG RANGE YEAR SAMPLED VIOLATION TYPICAL SOURCE OF CONTAMINANTS Drinking water disinfectant added for treatment Chlorine mg/l 4 4 n/a 0.88 .10-1.75 2021 No DISINFECTANT BY-PRODUCTS CONTAMINANT UNITS MCL PHG DLR AVE RANGE YEAR SAMPLED VIOLATION TYPICAL SOURCE OF CONTAMINANTS By-product of Drinking water disinfection Total Haloacetic Acids ppb 60 <1 <1 <1 0 2021 No By-product of Drinking water disinfection Trihalomethanes (Total) ppb 80 1.75 1.75 0 0 2021 No 11