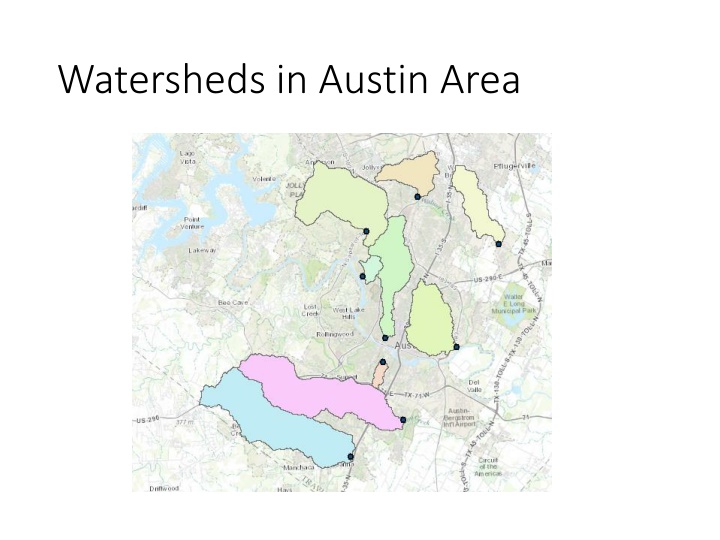
Watersheds and Soil Conservation Methods in Austin
Explore the concept of watersheds in the Austin area, along with the Soil Conservation Service (SCS) method used for determining rainfall excess. Learn about abstractions in the SCS method, surface impervious factors, SCS curve numbers, hydrologic soil groups, and more. Gain insights into Brushy Creek water bodies, land cover analysis through remote sensing, and access the City of Austin Drainage Criteria Manual for further information.

Download Presentation

Please find below an Image/Link to download the presentation.
The content on the website is provided AS IS for your information and personal use only. It may not be sold, licensed, or shared on other websites without obtaining consent from the author. If you encounter any issues during the download, it is possible that the publisher has removed the file from their server.
You are allowed to download the files provided on this website for personal or commercial use, subject to the condition that they are used lawfully. All files are the property of their respective owners.
The content on the website is provided AS IS for your information and personal use only. It may not be sold, licensed, or shared on other websites without obtaining consent from the author.
E N D
Presentation Transcript
SCS method Soil conservation service (SCS) method is an experimentally derived method to determine rainfall excess using information about soils, vegetative cover, hydrologic condition and antecedent moisture conditions The method is based on the simple relationship that Pe= P - Fa Ia = + + P P I F e a a Precipitation Pe is runoff depth, P is precipitation depth, Fa is continuing abstraction, and Ia is the sum of initial losses (depression storage, interception, ET) e P a I F a Time p t
Abstractions SCS Method In general P Pe After runoff begins S Fa = + + P P I F e a a Precipitation Potential runoff a I P e P SCS Assumption P S a I F a F a e = Time p t P I a Combining SCS assumption with P=Pe+Ia+Fa ( I P = Total = Rainfall P Rainfall Excess P e = Initial Abstractio n I a ) 2 P I = Continuing Abstractio n F a = a P e + = S S Potential Maximum Storage a
SCS Method (Cont.) Surface Impervious: CN = 100 Natural: CN < 100 Experiments showed S Ia 2 . 0 = So 12 100 90 80 70 60 40 20 10 ( ) 2 11 2 . 0 P S = Pe 10 Cumulative Direct Runoff, Pe, in 8 . 0 + P S 9 8 1000 CN 7 = 10 S 6 5 ( American Units; 0 CN 100) 4 3 25400 CN 2 = 254 S CN 1 0 SI ( Units; 30 CN 100) 0 1 2 3 4 5 6 7 8 9 10 11 12 Cumulative Rainfall, P, in
SCS Method (Cont.) SCS Curve Numbers depend on soil conditions Group Minimum Infiltration Rate (in/hr) 0.3 0.45 Hydrologic Soil Group A High infiltration rates. Deep, well drained sands and gravels Moderate infiltration rates. Moderately deep, moderately well drained soils with moderately coarse textures (silt, silt loam) Slow infiltration rates. Soils with layers, or soils with moderately fine textures (clay loams) Very slow infiltration rates. Clayey soils, high water table, or shallow impervious layer B 0.15 0.30 C 0.05 0.15 D 0.00 0.05
Land Cover Interpreted from remote sensing
City of Austin Drainage Criteria Manual https://www.municode.com/library/#!/tx/austin/codes/drainage_criteria_manual
Rational Method Source: Austin Drainage Criteria Manual, Chapter 2
Intensity-Duration-Frequency Curves 100 Precipitation Intensity (in/hr) 10 2-yr 5-yr 25-yr 1 100-yr 1 10 100 1000 10000 0.1 Duration (Mins)


")
")


