Wealth Transfers in the United States: Insights and Questions
Explore the dynamics of U.S. household wealth transfers, delving into the evolving trends, impacts on inequality, and intergenerational wealth mobility. Uncover the challenges of data availability and the two key perspectives on transfers, offering a comprehensive analysis of inheritance and inter vivos transfers.
Download Presentation

Please find below an Image/Link to download the presentation.
The content on the website is provided AS IS for your information and personal use only. It may not be sold, licensed, or shared on other websites without obtaining consent from the author. If you encounter any issues during the download, it is possible that the publisher has removed the file from their server.
You are allowed to download the files provided on this website for personal or commercial use, subject to the condition that they are used lawfully. All files are the property of their respective owners.
The content on the website is provided AS IS for your information and personal use only. It may not be sold, licensed, or shared on other websites without obtaining consent from the author.
E N D
Presentation Transcript
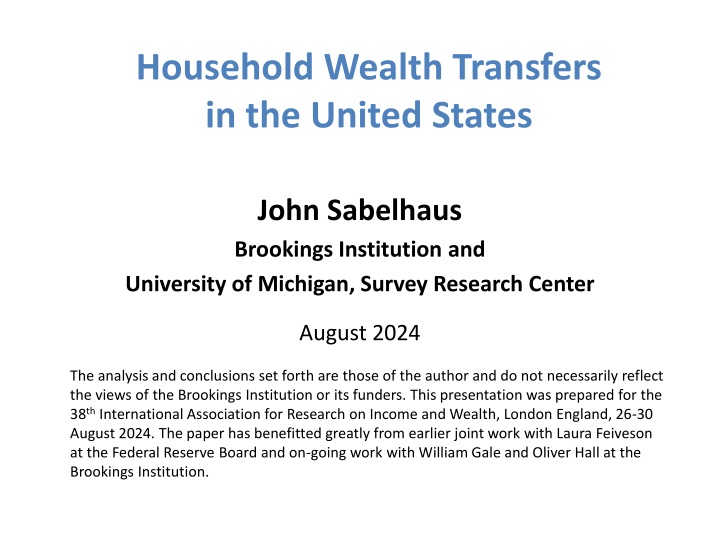
Household Wealth Transfers in the United States John Sabelhaus Brookings Institution and University of Michigan, Survey Research Center August 2024 The analysis and conclusions set forth are those of the author and do not necessarily reflect the views of the Brookings Institution or its funders. This presentation was prepared for the 38th International Association for Research on Income and Wealth, London England, 26-30 August 2024. The paper has benefitted greatly from earlier joint work with Laura Feiveson at the Federal Reserve Board and on-going work with William Gale and Oliver Hall at the Brookings Institution.
Motivating questions 1. How comprehensive are measures of U.S. household wealth transfers in available data? 2. Is the incidence, timing, and concentration of wealth transfers changing over time? 3. How do household wealth transfers affect our understanding of cross-section inequality? 4. What is the role of wealth transfers for intergenerational wealth mobility and wealth concentration?
Lack of data on wealth transfers in U.S. U.S. household panels like PSID and HRS capture some transfers, lack high wealth Charles and Hurst (2003) SCF cross-sections used to study trends in wealth transfers, wealth transfer taxes Nolan et al (2022), Avery et al (2016), Gale, et al (2020, 2024) Scandinavian registries used to study wealth transfers and intergenerational wealth mobility Adermon, et al (2018), Boserup et al (2018), Elinder et al (2018) But can we answer intergenerational questions with cross-section data? Boileau and Sturrock (2023), Bourquin et al (2020, 2021), Feiveson and Sabelhaus (2018, 2019)
Two Perspectives on Two Types of Transfers Transfers At Death Inter Vivos Transfers Inheritance module Inheritance module Transfers Received Supplement using real asset sources and cash inheritance under other income in income module Supplement using other forms of support and gifts under other income in income module No direct measure (no posthumous interviews) Stand-alone question on regular support paid and substantial gifts made Transfers Made Simulate estates using survey wealth holdings, differential mortality, fixed death costs, and split across estimated number of heirs We can measure and validate Survey Year transfersusing various modules Lifetime Transfers = recall received to date + expected future inheritances
Survey Year Wealth Transfers
Key takeaways: Survey Year Transfers SCF reported inheritances and simulated bequests similar => capturing transfers at death But inter vivos transfers made are much larger than received => missing key source of funds for low to moderate income/young households Total wealth transfers stable around 4 percent of NIPA Personal Income over past 25 years Concentration of wealth transfers received (top 10% share, various metrics) very high but stable
Simulated bequests reported inheritances $700 $600 Simulated Bequests Reported Inheritances $500 $400 Billions $300 $200 $100 $- 1997 2000 2003 2006 2009 2012 2015 2018 2021
Size distribution inheritances and bequests, 2021 $300 Simulated Bequests Reported Inheritances $250 $200 $150 Billions $100 $50 $- <$5,000 $5,000 to <$10,000 $10,000 to <$25,000 $25,000 to <$50,000 $50,000 to <$100,000 $100,000 to <$500,000 $500,000 to <$1,000,000 $1,000,000 plus
But reported inter vivos made > received $300 Inter Vivos Transfers Made Inter Vivos Transfers Received $250 $200 $150 Billions $100 $50 $- 1997 2000 2003 2006 2009 2012 2015 2018 2021
Size distribution Inter Vivos, 2021 $70 Inter Vivos Transfers Made Inter Vivos Transfers Received Counts of inter vivos received 3 million, transfers made 20 million! $60 55 percent of missing transfer dollars <$25,000 $50 $40 Billions $30 $20 $10 $- <$5,000 $5,000 to <$10,000 $10,000 to <$25,000 $25,000 to <$50,000 $50,000 to <$100,000 $100,000 to <$500,000 $500,000 to <$1,000,000 $1,000,000 plus
Total = inheritances + inter vivos made truth? $1,000 Preferred estimate $850 billion in 2021 Inheritances Plus Reported Inter Vivos Received Inheritances Plus Reported Inter Vivos Made $800 $600 Billions $400 $200 $0 1997 2000 2003 2006 2009 2012 2015 2018 2021
Transfers stable relative to NIPA Personal Income Preferred estimate of total annual transfers is inheritances received plus inter vivos made, stable around 3% + 1% = 4% of NIPA Personal Income 4% 3% Inheritances Received Simulated Bequests Inter Vivos Received Inter Vivos Made Percent 2% 1% 0% 1997 2000 2003 2006 2009 2012 2015 2018 2021
No (big) trend in share of transfers to top 10% Caveat: From this point forward everything is based on transfers received, so we know we are missing smaller inter vivos. 75% 50% Percent 25% Sorted by Income Sorted by Wealth Sorted by Wealth Less Survey Year Transfers 0% 1997 2000 2003 2006 2009 2012 2015 2018 2021 Note: SCF sorting is within year and age groups
Implications for Tax Modeling Validation on large wealth transfers made and received => model revenue and distributional effects of estate and inheritance taxes Missing piece is Forbes 400, in progress SCF also makes it possible to estimate unrealized capital gains component of wealth transfers, so we can also model (e.g.) repealing step up in basis at death
Implications for cross section inequality Consumer Expenditure Survey (2021) shows bottom quintile has $424 billion income plus $9 billion in transfers; they spend $822 billion SCF: additional $150 billion income first quintile Large gaps ($390 billion CEX, $238 billion using SCF incomes) characterized as dissaving or borrowing, but balance sheets disagree Bosworth, Burtless, Sabelhaus (1991), Sabelhaus (1993), Sabelhaus and Groen (2000) Is this mostly uncounted (especially inter vivos) wealth transfers? $146 billion explains a lot
Path forward on survey year wealth transfers Long run solution is improving questions on inter vivos wealth transfers received (not just SCF!) Inheritance plus inter vivos transfers made ($850 billion in 2021) probably a solid lower bound (but further reconciling inheritances and bequests, adding Forbes 400 logical next steps) Micro reconciliation: Impute missing inter vivos based on characteristics of recipients; 10 million or more <$25k from parents to children
Constructing Lifetime Transfers Focus on wealth transfers received, which means Only inheritance module has retrospective lifetime receipts; survey year income module receipts obviously not available for pre-survey years Caveat that the inheritance recall module is certainly missing small to modest inter vivos transfers received Lifetime wealth transfers is age-specific: it is the sum of wealth transfers through current age and expected inheritances at that age
Key takeaways: Lifetime Transfers The timing of lifetime wealth transfer receipt has shifted because of increased life expectancy Households ages 45 to 64 have received about half of their lifetime transfers, rest is expected Lifetime wealth transfer concentration > wealth concentration, but changes over time similar Strong correlation between lifetime wealth transfers and own income, wealth; evidence of wealth transmission mechanisms
Age profile of wealth transfer receipt shifting 2.5% 2.0% Survey Years 1998 to 2010 Survey Years 2013 to 2022 1.5% Percent of Households 1.0% 0.5% 0.0% 18 20 22 24 26 28 30 32 34 36 38 40 42 44 46 48 50 52 54 56 58 60 62 64 66 68 70 72 74 Age
Fraction ever receiving transfers increasing 40% Survey Years 1998 to 2010 Survey Years 2013 to 2022 30% Percent of Households 20% 10% 0% 18 20 22 24 26 28 30 32 34 36 38 40 42 44 46 48 50 52 54 56 58 60 62 64 66 68 70 72 74 Age
Fraction expecting inheritance rising at older ages 30% Survey Years 1998 to 2010 Survey Years 2013 to 2022 20% Percent of Households 10% 0% 18 20 22 24 26 28 30 32 34 36 38 40 42 44 46 48 50 52 54 56 58 60 62 64 66 68 70 72 74 Age
Incidence of Lifetime Wealth Transfers All Households Ages 45 to 64 Ages 45 to 64, Top 10 % by Wealth 1998 to 2010 2013 to 2022 1998 to 2010 2013 to 2022 Fraction of households with positive lifetime transfers 32% 33% 52% 52% Lifetime transfers relative to current household wealth 18% 17% 13% 13% Note: SCF mid-life sample, sorting is within year and age groups
Top 10 Percent Shares Top 10% Households Sorted by Wealth Top 10% Households Sorted by Income 1998 to 2010 66% 2013 to 2022 69% 1998 to 2010 57% 2013 to 2022 59% Share of Wealth Share of Lifetime Transfers 49% 52% 45% 40% Note: SCF mid-life sample, sorting is within year and age groups
Intergenerational Wealth Correlations Dependent Variable = Top 10 % by Current Wealth Dependent Variables = Wealth Determinants Add Controls = Risk, Degrees, Business Take Above Average Risk Only Wealth Transfer Controls PhD, MD, JD Degrees Masters Degree Business Owner Population Average 21% 13% 5% 12% 10% 10% Marginal Effect, Top 10% of Lifetime Transfers 15% 13% 9% 18% 25% 18% Note: Regression coefficients, linear probability models, SCF mid-life sample
Lifetime transfers research: Whats possible? Research on intergenerational wealth transmission size and mechanisms mostly based on Scandinavian registry data Results here suggest we can identify those mechanisms by constructing parent side of the data set using retrospective and expected inheritance questions More egalitarian policy should focus on the mechanisms: Why do rich parents have rich kids?
Thanks! jsabelhaus@gmail.com
Table 1. Estimated Annual Wealth Transfers Billions of Dollars 1997 2000 2003 2006 2009 2012 2015 2018 2021 Inheritances Received 197.4 265.9 251.7 349.8 328.0 437.6 424.7 562.0 599.1 Bequests Made 118.7 150.2 202.1 308.4 313.0 291.0 365.0 480.8 631.8 Gap 78.7 115.6 49.5 41.4 15.0 146.6 59.7 81.2 -32.7 Inter Vivos Transfers Received 29.1 21.5 27.2 64.0 105.0 68.1 80.5 99.8 100.8 Inter Vivos Transfers Made 63.4 100.1 119.6 203.7 145.1 169.5 154.4 173.3 247.5 Gap -34.3 -78.6 -92.3 -139.7 -40.1 -101.4 -73.9 -73.5 -146.7 Total Transfers Received 226.5 287.3 278.9 413.8 433.0 505.8 505.2 661.8 699.9 Total Transfers Made 182.1 250.3 321.7 512.1 458.1 460.5 519.5 654.1 879.3 Gap 44.4 37.0 -42.8 -98.3 -25.1 45.2 -14.2 7.7 -179.4 Addendum: Inheritances + Inter Vivos Made 260.8 365.9 371.2 553.5 473.1 607.1 579.1 735.3 846.6 Percent of Personal Income 1997 2000 2003 2006 2009 2012 2015 2018 2021 Inheritances Received 2.8% 3.1% 2.7% 3.1% 2.7% 3.1% 2.7% 3.2% 2.8% Bequests Made 1.7% 1.7% 2.1% 2.7% 2.6% 2.1% 2.4% 2.7% 3.0% Inter Vivos Transfers Received 0.4% 0.2% 0.3% 0.6% 0.9% 0.5% 0.5% 0.6% 0.5% Inter Vivos Transfers Made 0.9% 1.2% 1.3% 1.8% 1.2% 1.2% 1.0% 1.0% 1.2% Inheritances + Inter Vivos Made 3.7% 4.2% 3.9% 4.9% 3.9% 4.4% 3.7% 4.2% 4.0% Notes: Author's calculations using Survey of Consumer Finances 1998-2022, National Income and Product Accounts
Table 2. Estimated Incidence of Annual Wealth Transfers Thousands of Recipients 1997 2000 2003 2006 2009 2012 2015 2018 2021 Inheritances Received 2,120 2,192 2,593 2,336 2,308 2,599 2,376 2,980 3,001 Bequests Made 1,655 1,797 2,167 2,441 2,330 2,412 2,489 2,653 2,983 Gap 464 394 427 -105 -22 187 -113 327 18 Inter Vivos Transfers Received 1,179 1,146 2,036 2,380 2,576 2,678 2,718 3,521 2,864 Inter Vivos Transfers Made 13,306 15,933 17,460 22,370 19,758 17,782 20,292 21,089 22,487 Gap -12,127 -14,787 -15,424 -19,990 -17,182 -15,103 -17,573 -17,568 -19,624 Total Transfers Received 3,298 3,338 4,629 4,716 4,884 5,277 5,094 6,501 5,865 Total Transfers Made 14,961 17,730 19,627 24,812 22,088 20,194 22,780 23,743 25,471 Gap -11,663 -14,393 -14,997 -20,095 -17,204 -14,917 -17,686 -17,242 -19,606 Addendum: Inheritances + Inter Vivos Made 15,425 18,125 20,053 24,706 22,066 20,381 22,668 24,069 25,489 Percent of Households 1997 2000 2003 2006 2009 2012 2015 2018 2021 Inheritances Received 2.1% 2.1% 2.3% 2.0% 2.0% 2.1% 1.9% 2.3% 2.3% Bequests Made 1.6% 1.7% 1.9% 2.1% 2.0% 2.0% 2.0% 2.1% 2.3% Inter Vivos Transfers Received 1.1% 1.1% 1.8% 2.0% 2.2% 2.2% 2.2% 2.7% 2.2% Inter Vivos Transfers Made 13.0% 15.0% 15.6% 19.3% 16.8% 14.5% 16.1% 16.4% 17.1% Inheritances + Inter Vivos Made 15.0% 17.0% 17.9% 21.3% 18.8% 16.6% 18.0% 18.7% 19.4% Notes: Author's calculations using Survey of Consumer Finances, 1998-2022
Table 3. Size Distribution of Wealth Transfers 2021 (Billions of Dollars) Less than $5,000 $5,000 to 9,999 $10,000 to 24,999 $25,000 to 49,999 $50,000 to 99,999 $100,000 to 499,999 $500,000 to 999,999 $1 million or more Total Inheritances Received 0.7 1.4 6.2 15.7 27.1 213.4 99.8 234.8 599.1 Bequests Made 0.6 1.4 6.5 15.4 26.7 229.6 99.9 251.6 631.8 Gap 0.0 0.0 -0.3 0.3 0.4 -16.2 -0.1 -16.7 -32.7 Inter Vivos Transfers Received 2.6 5.3 10.5 6.2 7.5 21.6 6.2 40.9 100.8 Inter Vivos Transfers Made 24.9 29.7 57.8 35.7 23.1 38.7 12.9 49.5 272.4 Gap -22.3 -24.4 -47.3 -29.5 -15.7 -17.1 -6.7 -8.6 -171.6 1997 (Billions of Dollars) Less than $5,000 $5,000 to 9,999 $10,000 to 24,999 $25,000 to 49,999 $50,000 to 99,999 $100,000 to 499,999 $500,000 to 999,999 $1 million or more Total Inheritances Received 0.5 1.6 8.3 8.3 16.7 86.6 27.6 47.9 197.4 Bequests Made 0.7 1.5 5.9 10.5 15.8 63.1 10.4 10.8 118.7 Gap -0.2 0.1 2.3 -2.3 0.9 23.5 17.3 37.1 78.7 Inter Vivos Transfers Received 0.8 2.0 3.1 1.7 6.0 13.3 1.8 0.4 29.1 Inter Vivos Transfers Made 16.6 13.3 17.8 11.3 11.7 2.1 0.0 0.1 72.9 Gap -15.8 -11.3 -14.7 -9.6 -5.7 11.2 1.8 0.3 -43.8 Notes: Author's calculations using Survey of Consumer Finances, 1998-2022
Table 4. Inter Vivos Transfers Made by Recipient Billions of Dollars 1997 2000 2003 2006 2009 2012 2015 2018 2021 Total 63.4 100.1 119.6 203.7 145.1 169.5 154.4 173.3 247.5 Percent of Total 100% 100% 100% 100% 100% 100% 100% 100% 100% Children Younger than 18 3.2 5.4 10.9 31.3 6.0 3.2 4.7 6.6 8.7 Percent of Total 5% 5% 9% 15% 4% 2% 3% 4% 3% Children 18 to 24 8.3 11.7 13.8 19.1 18.3 14.5 21.8 24.1 16.6 Percent of Total 13% 12% 12% 9% 13% 9% 14% 14% 7% Children 25 and Older 25.0 39.5 41.2 61.5 56.1 69.9 60.6 64.4 120.1 Percent of Total 39% 40% 34% 30% 39% 41% 39% 37% 49% Other Relatives 22.6 39.6 46.2 85.5 55.4 65.7 60.1 67.6 87.7 Percent of Total 36% 40% 39% 42% 38% 39% 39% 39% 35% Non Relatives 4.3 3.8 7.5 6.2 9.3 16.2 7.3 10.7 14.4 Percent of Total 7% 4% 6% 3% 6% 10% 5% 6% 6% Addendum: Parent Support Rate, Children 18 + 8.7% 10.7% 10.6% 12.8% 11.9% 10.4% 10.1% 11.1% 10.5% Notes: Author's calculations using Survey of Consumer Finances 1998-2022
Table 5. Share of Transfers Received by Top 10 Percent of Households Billions of Dollars 2006 2009 Inheritances Plus Inter Vivos Transfers Received 278.9 413.8 433.0 73.1 132.6 119.9 26% 32% 28% 163.2 235.5 233.0 59% 57% 54% 88.9 132.1 129.0 32% 32% 30% Inheritances 251.7 349.8 328.0 68.2 122.1 102.1 27% 35% 31% 157.7 207.4 160.4 63% 59% 49% 83.4 117.2 112.7 33% 34% 34% 1997 2000 2003 2012 2015 2018 2021 Total 226.5 84.7 37% 136.1 60% 102.0 45% 287.3 123.1 43% 160.9 56% 97.9 34% 505.8 176.7 35% 267.8 53% 193.8 38% 505.2 159.7 32% 274.7 54% 171.2 34% 661.8 257.7 39% 404.5 61% 335.8 51% 699.9 256.9 37% 355.4 51% 278.8 40% Top Ten Percent by Income Share of Total Top Ten Percent by Wealth Share of Total Top Ten Percent by Pre-Transfer Wealth Share of Total Total 197.4 77.3 39% 123.5 63% 96.9 49% 265.9 116.5 44% 154.0 58% 91.0 34% 437.6 169.8 39% 240.5 55% 171.1 39% 424.7 137.6 32% 226.3 53% 148.2 35% 562.0 217.0 39% 377.8 67% 313.2 56% 599.1 218.4 36% 296.5 49% 230.1 38% Top Ten Percent by Income Share of Total Top Ten Percent by Wealth Share of Total Top Ten Percent by Pre-Transfer Wealth Share of Total Notes: Author's calculations using Survey of Consumer Finances 1998-2022, top ten percent based on per-adults measures within age groups
Table 6. Incidence and Relevance of Lifetime Transfers for Mid-Life Households Lifetime Transfers Relative to Wealth Less Transfers Received Percent with Any Transfers Received or Expected Share of Lifetime Transfers Already Received Lifetime Transfers Relative to Wealth Lifetime Transfers Relative to Income Group All Households Survey Years 1998 to 2010 32% 53% 18% 120% 20% Survey Years 2013 to 2022 33% 50% 17% 120% 18% Top 10 Percent by Income Survey Years 1998 to 2010 46% 53% 14% 132% 15% Survey Years 2013 to 2022 48% 52% 11% 109% 12% Top 10 Percent by Wealth Survey Years 1998 to 2010 52% 57% 13% 162% 14% Survey Years 2013 to 2022 52% 58% 13% 157% 14% Top 10 Percent by Wealth Less Transfers Received Survey Years 1998 to 2010 47% 47% 8% 101% 9% Survey Years 2013 to 2022 47% 43% 9% 112% 9% Note: Mid-life sample is SCF households where oldest of respondent or spouse is 45 to 64. Top 10 percent based on sorting within age groups and year.
Table 7. Concentration of Income, Wealth, and Lifetime Transfers for Mid-Life Households Share of Wealth Less Transfers Already Received Share of Share of Expected Future Transfers Share of Lifetime Transfers Top 10 Percent of Households by: Share of Wealth Share of Income Transfers Already Received Income Survey Years 1998 to 2010 Survey Years 2013 to 2022 57% 59% 41% 44% 58% 61% 45% 40% 45% 41% 44% 39% Wealth Survey Years 1998 to 2010 Survey Years 2013 to 2022 Wealth Less Transfers Received Survey Years 1998 to 2010 Survey Years 2013 to 2022 Note: Mid-life sample is SCF households where oldest of respondent or spouse is 45 to 64. Top 10 percent based on sorting within age groups and year. 66% 69% 36% 39% 67% 70% 49% 52% 53% 60% 44% 44% 65% 68% 36% 39% 69% 71% 30% 37% 27% 31% 34% 42%
Table 8. Correlations between Lifetime Wealth Transfers and Wealth Determinants for Mid-Life Households Willing to Take Above Average or Substantial Risk PhD or Professional Degree Lifetime Wealth Transfers Group Masters Degree Business Owner Top 10 15.21*** 13.13*** 8.883*** 17.96*** (0.586) (0.530) (0.365) (0.535) 80th to 90th 7.566*** 8.543*** 2.483*** 7.590*** (0.584) (0.540) (0.306) (0.503) 70th to 80th 4.061*** 0.640** 0.622*** 2.202*** (0.371) (0.311) (0.177) (0.305) Constant 18.06*** 12.78*** 4.037*** 12.64*** (0.211) (0.183) (0.0995) (0.175) Observations 99,802 99,802 99,802 99,802 R-squared 0.013 0.015 0.014 0.022 Notes: Mid-life sample is SCF households where oldest of respondent or spouse is 45 to 64. Top 10 percent based on sorting within age groups and year. Robust standard errors in parentheses. *** p<0.01, ** p<0.05, * p<0.1
Table 9. Mid-Life Probability of Being in Top 10 Percent by Various Classifiers Top 10 Percent by Wealth Less Transfers Already Received Top 10 Percent by Income Top 10 Percent byWealth Lifetime Transfers Group: Top 10 19.08*** 10.94*** 25.41*** 17.52*** 18.77*** 10.59*** (0.474) (0.454) (0.502) (0.481) (0.453) (0.425) 80th to 90th 4.202*** 0.649* 5.168*** 1.722*** 4.641*** 1.048*** (0.380) (0.362) (0.361) (0.354) (0.362) (0.356) 70th to 80th -0.0999 -0.966*** 0.563*** -0.333* 0.629*** -0.300 (0.205) (0.197) (0.187) (0.182) (0.201) (0.194) Additional Controls: Take Above Avearge Risk 6.624*** 5.953*** 6.225*** (0.287) (0.273) (0.276) Masters Degree 14.08*** 10.55*** 11.32*** (0.393) (0.358) (0.370) PhD or Professional Degree 30.25*** 21.54*** 21.83*** (0.741) (0.666) (0.673) Business Owner 14.47*** 20.55*** 21.25*** (0.354) (0.375) (0.381) Constant 7.162*** 1.118*** 6.137*** 0.247** 6.818*** 0.681*** (0.123) (0.111) (0.105) (0.0982) (0.114) (0.103) Observations 99,802 99,802 99,802 99,802 99,802 99,802 R-squared 0.038 0.189 0.067 0.209 0.037 0.189 Notes: Mid-life sample is SCF households where oldest of respondent or spouse is 45 to 64. Top 10 percent based on sorting within age groups and year. Robust standard errors in parentheses. *** p<0.01, ** p<0.05, * p<0.1
SCF reported inheritances and gifts received Inheritance module questions seek to capture substantial lifetime inheritance and gifts received Misses some transfers that were only captured in how you gained ownership in real asset modules (housing, real estate, businesses) and inheritances/support in income modules Including real asset transfers (then subtracting double counting in inheritance module) adds about 20 percent to transfer receipts, brings US more into line with (e.g.) U.K. Nolan, et al (2022)
SCF reported inter vivos transfers made Separate question battery asks about regular support in past year, with interviewer instruction to include substantial gifts Survey includes total amount and check all for recipients (children <18, children 18 and older, other relatives, non-relatives) Exclude diminimus (< $1,000 real) but counts and dollars of reported inter vivos transfers made are still well above transfers received
Simulating bequests Bequest simulation involves transferable wealth (wit), marital status, differential mortality ( it), fixed costs of dying (fit), number of heirs (hit) For comparison to inheritances, person i makes hit bequests of size (wit - fit)/hit with probability it All wealth in couples goes to a surviving spouse (but possible for both to die) Strategy builds on previous work using SCF Avery, Grodzicki, and Moore (2016), Feiveson and Sabelhaus (2018), Gale, Pulliam, Sabelhaus, and Sawhill (2022).
Differential mortality Starting point is age-gender-year specific average mortality rates ( agt) from Social Security Mortality differentials constructed using outputs from linked tax and death records Chetty, et al (2016) Years 2001-14, ages 40-76, male and female Compute mortality across 100 income percentiles Pool years, compute relative mortality ( agk) for income percentiles k=1, ,100 by age and gender Fit cubic of relative mortality in percentile Differential mortality for individual i of age a, gender g, year t, percentile k is then is it = ( agt)*( agk)
Differential mortality Chetty et al data covers ages 40 to 76 Set relative mortality equal to 1 before age 40 Very few deaths before age 40, small differentials Extrapolate relative mortality linearly to age 100 Survivors at age 100 all have agk = 1 Consistent with convergent patterns in observed part of the age distribution As lower income population dies off, remaining differentials disappear
Applying differential mortality How much does differential mortality matter? Compute income percentiles using SCF normal income variable for four age groups (<35, 35-44, 45-54, 65+) in each survey year Gross simulated wealth transfers at death (before spousal, fixed death cost, or number of heirs adjustments) are 35 percent higher when using average mortality instead of differential Not about number of deaths, it s about who dies
Survey year reported transfers rising over time $1,000 Inheritances, Transfer Module Inter Vivos Received, Transfer Module $800 Inheritances, Income and Asset Modules Inter Vivos Received, Income Module $600 Billions $400 $200 $0 1997 2000 2003 2006 2009 2012 2015 2018 2021
We know to whom missing inter vivosgoing Children 25 and older Children 18 to 24 Other Relatives Non Relatives Children under 18 100% 2% 3% 3% 4% 4% 5% 5% 9% 5% 6% 10% 6% 4% 6% 15% 7% 90% 6% 3% 80% 35% 39% 40% 39% 38% 36% 70% 39% 39% 42% 60% 7% 50% Percent 14% 13% 9% 12% 13% 14% 12% 40% 9% 30% 49% 41% 40% 39% 20% 39% 39% 37% 34% 30% 10% 0% 1997 2000 2003 2006 2009 2012 2015 2018 2021
SCF Inheritance and Gift Module X5801 Including any gifts or inheritances you may have already told me about, have you (or your {husband/wife/partner/spouse}) ever received an inheritance, or been given substantial assets in a trust or in some other form? IF YES: Please do not include inheritances from a deceased spouse. X5802 How many of these have you (or your {husband/wife/partner/spouse} ever received? ----------------------------------------------------------------------------- #1 refers to the first gift/inheritance #2 refers to the second gift/inheritance #3 refers to the third gift/inheritance #4 refers to all remaining gifts/inheritances -----------------------------------------------------------------------------
SCF Inheritance and Gift Module (Continued) X5803(#1) Was that an inheritance, a trust, or something else? X5808(#2) X5813(#3) 1. *INHERITANCE; life insurance; other settlements 2. *TRUST 3. *TRANSFER/GIFT 6. *INHERITED TRUST -7. *OTHER X5804(#1) What was its approximate value at the time it was received? X5809(#2) X5814(#3)
SCF Inheritance and Gift Module (Continued) X5805(#1) In what year was it received? X5810(#2) X5815(#3) X5818(#4) How much altogether were any others you have received?

