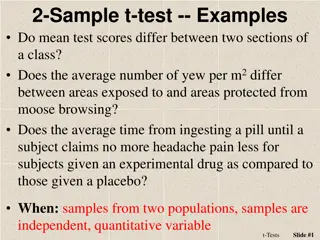
Explore the Welch's 2-sample t-test, covering its capabilities, working principle, and how to conduct it in R. Discover the assumptions, examples, and interpretation of results for comparing average masses of apples and oranges. Visualize data and draw conclusions based on statistical analysis.
Please find below an Image/Link to download the presentation.
The content on the website is provided AS IS for your information and personal use only. It may not be sold, licensed, or shared on other websites without obtaining consent from the author. If you encounter any issues during the download, it is possible that the publisher has removed the file from their server.
You are allowed to download the files provided on this website for personal or commercial use, subject to the condition that they are used lawfully. All files are the property of their respective owners.
The content on the website is provided AS IS for your information and personal use only. It may not be sold, licensed, or shared on other websites without obtaining consent from the author.
E N D
Presentation Transcript
Welchs 2-sample t-test 1) What can it do? 2) How does it work? 3) How to perform Welch s t-test in R? Note: this video is intended to follow the video regarding a (standard) 2-sample t-test 1
Welchs 2-sample t-test Does the average mass of an apple differ significantly from the average mass of an orange? vs. Allows unequal variance 2 Orange by wuestenigel CC BY 2.0 Apple by idpams CC BY 2.0
Welchs 2-sample t-test How does it work? X1 X2 sp t = Difference between the means Measure of uncertainty Adjusts degrees of freedom (d.f.); d.f., may be a fraction 3
Assumptions of Welchs 2-sample t-test 1. Random sampling 2. Independence 3. Homogeneity of variances (no outliers) 4. Normality within each group (no outliers) Plot your data! 4
An example in R Set up data: What is the average size of apples? Oranges? What is the estimated difference in mass between apples and oranges? 7
An example in R Set up data: Do our data suggest that apples and oranges differ in size, on average? 8
An example in R Set up data: Our samples indicates that apples (mean mass +/- SE: 11.9g +/- 0.3) and oranges (15.1 +/- 0.7) differ in mass by (95% CI) 1.26 5.02 g, which differs significantly from zero (Welch s t-test; t = 4.24, df = 5.23, p = 0.0074). Plot data, too; state sample sizes 9