West Virginia Middle School Survey 2017 Youth Risk Behavior Results
The West Virginia Middle School Survey 2017 reveals concerning youth risk behavior percentages among students, including seat belt usage, alcohol and drug consumption, weapon carrying, and other risky activities. The survey provides insights into the behaviors and attitudes of middle school students in West Virginia.

Uploaded on Feb 28, 2025 | 1 Views
Download Presentation

Please find below an Image/Link to download the presentation.
The content on the website is provided AS IS for your information and personal use only. It may not be sold, licensed, or shared on other websites without obtaining consent from the author.If you encounter any issues during the download, it is possible that the publisher has removed the file from their server.
You are allowed to download the files provided on this website for personal or commercial use, subject to the condition that they are used lawfully. All files are the property of their respective owners.
The content on the website is provided AS IS for your information and personal use only. It may not be sold, licensed, or shared on other websites without obtaining consent from the author.
E N D
Presentation Transcript
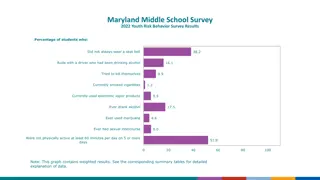
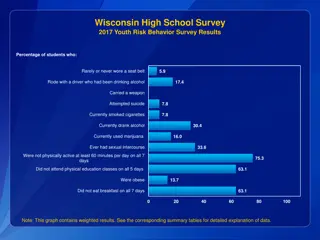
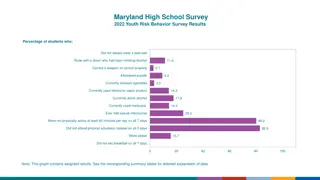
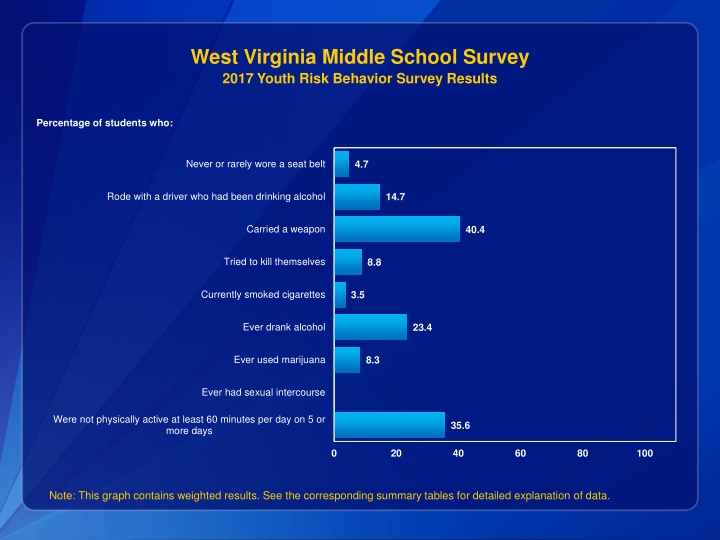
West Virginia Middle School Survey 2017 Youth Risk Behavior Survey Results Percentage of students who: Never or rarely wore a seat belt 4.7 Rode with a driver who had been drinking alcohol 14.7 Carried a weapon 40.4 Tried to kill themselves 8.8 Currently smoked cigarettes 3.5 Ever drank alcohol 23.4 Ever used marijuana 8.3 Ever had sexual intercourse Were not physically active at least 60 minutes per day on 5 or more days 35.6 0 20 40 60 80 100 Note: This graph contains weighted results. See the corresponding summary tables for detailed explanation of data.
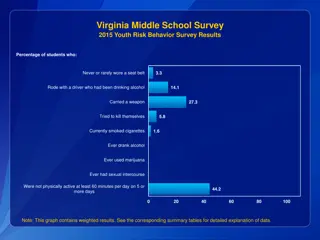
West Virginia Middle School Survey 2017 Youth Risk Behavior Survey Results Percentage of students who: Sometimes, most of the time, or always wore a seat belt 95.3 Did not ride with a driver who had been drinking alcohol 85.3 Never carried a weapon 59.6 Never tried to kill themselves 91.2 Did not currently smoke cigarettes 96.5 Never drank alcohol 76.6 Never used marijuana 91.7 Never had sexual intercourse Were physically active at least 60 minutes per day on 5 or more days 64.4 0 20 40 60 80 100 Note: This graph contains weighted results. See the corresponding summary tables for detailed explanation of data.
West Virginia Middle School Survey 2017 Youth Risk Behavior Survey Results Number of students in a class of 30 who: Never or rarely wore a seat belt 1.4 Rode with a driver who had been drinking alcohol 4.4 Carried a weapon 12.1 Tried to kill themselves 2.6 Currently smoked cigarettes 1.1 Ever drank alcohol 7.0 Ever used marijuana 2.5 Ever had sexual intercourse Were not physically active at least 60 minutes per day on 5 or more days 10.7 0 10 20 30 Note: This graph contains weighted results. See the corresponding summary tables for detailed explanation of data.
West Virginia Middle School Survey 2017 Youth Risk Behavior Survey Results Number of students in a class of 30 who: Sometimes, most of the time, or always wore a seat belt 28.6 Did not ride with a driver who had been drinking alcohol 25.6 Never carried a weapon 17.9 Never tried to kill themselves 27.4 Did not currently smoke cigarettes 29.0 Never drank alcohol 23.0 Never used marijuana 27.5 Never had sexual intercourse Were physically active at least 60 minutes per day on 5 or more days 19.3 0 10 20 30 Note: This graph contains weighted results. See the corresponding summary tables for detailed explanation of data.