(WESTAR/WRAP) formerly, Tom Richardson
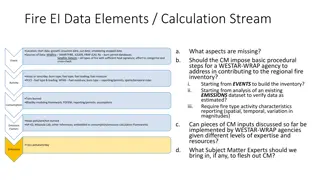
Team consisting of over 30 collaborators representing various agencies and states working on oil and gas emissions projections for future years. Detailed work completed and in progress through different stages. Includes base year emissions data and future growth projections.

Download Presentation

Please find below an Image/Link to download the presentation.
The content on the website is provided AS IS for your information and personal use only. It may not be sold, licensed, or shared on other websites without obtaining consent from the author.If you encounter any issues during the download, it is possible that the publisher has removed the file from their server.
You are allowed to download the files provided on this website for personal or commercial use, subject to the condition that they are used lawfully. All files are the property of their respective owners.
The content on the website is provided AS IS for your information and personal use only. It may not be sold, licensed, or shared on other websites without obtaining consent from the author.
E N D
Presentation Transcript
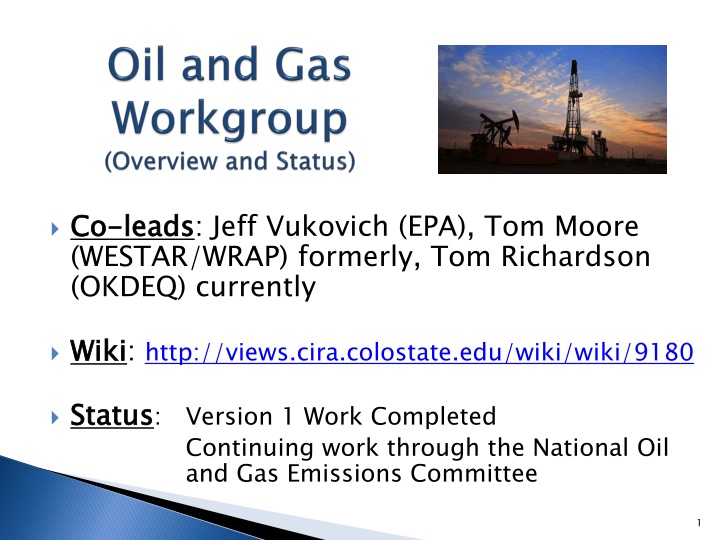
Co (WESTAR/WRAP) formerly, Tom Richardson (OKDEQ) currently Co- -leads leads: Jeff Vukovich (EPA), Tom Moore Wiki Wiki: http://views.cira.colostate.edu/wiki/wiki/9180 Status Status: Version 1 Work Completed Continuing work through the National Oil and Gas Emissions Committee 1
Summary First workgroup call on March 12, 2018. Final stand-alone workgroup call on November 18, 2019. Summary The Team Over 30 collaborators representing 15 states, 2 local/regional agencies, 3 MJOs, 2 contractors, EPA regional and OAQPS staff, and non-EPA federal agency partners. The Team Work Product Point and nonpoint base year (2016) oil and gas emissions and projection approaches for future years, focusing on 2023 and 2028. Work progression through Alpha, Beta, and Version 1 Work Product 2
2016 Base year emissions for Version 1 2016 Base year emissions for Version 1 Point SCCs sources and for Type B sources where available. (Grew 2014 NEI Version 2 emissions for Type B sources as needed.) Point SCCs: used 2016 AERR submissions for all AERR Type A Nonpoint production sources oil and gas emissions inventory tool with 2016 activity data. (Some states supplied alternative approaches.) Nonpoint production sources: used an updated version of the Nonpoint exploration sources 2017) activity data and the oil and gas emissions inventory tool. Nonpoint exploration sources: used 4-year average (2014- 3
Future Growth for point and nonpoint production-related sources (SCCs in nonpoint and NAICS in point sources): used AEO2019 reference Future- -year projections for Version 1 year projections for Version 1 AEO2019 reference case case Nonpoint exploration sources: Used 4-year average (2014- 2017) emissions dataset (no growth) Added NJ control information for pipeline compressor(s). Used VA natural gas transmissions future year emissions. Applied controls for future-year activity increases and for equipment turnover (e.g., diesel engines on drilling rigs). 4
National Exploration yearly trends and 4 year average 5
EIA State Production vs. VOC Emissions (2016v1) 6
2016 version 1 Nonpoint oil and gas NOx (tons/yr) 2028 2016 NOx % change in nonpoint oil and gas emissions 10
Integrate WESTAR/WRAP oil and gas emissions into the platform for Version 1.1 Compare EMP oil and gas emissions with the 2017 NEI Ongoing efforts to improve the inventory Capture efficiency and control efficiency for tanks Missing sources Additional improvements (top-down vs. bottom-up reconciliation, etc.) Continuing evaluation of projections Forecasting exploration activity Incorporating decline curves into the growth and control approach 11
Wiki Page for Oil and Gas Workgroup: http://views.cira.colostate.edu/wiki/wiki/9180 Oil and Gas Group Link to Charge Document: https://docs.google.com/document/d/1gSPGuunaE5J5Xbm2Cj11C72j6bq 4zwdUBsV9MMBpiKE/ Alignment between 2016 Emissions Modeling Platform (EMP) and the 2017 NEI: http://views.cira.colostate.edu/wiki/Attachments/Inventory%20Collaborat ive/oilgas_files/Alignment_between_national2016EMPand2017NEI_OandG _EIwork_draft_March%207_2018%20v2.pdf Master Collaborative Work Google Drive: https://drive.google.com/drive/folders/1QpNUcbQxkuO_wLZLrYR83QJF5 PDtBubh 12
2016 Version 1 documentation: http://views.cira.colostate.edu/wiki/wiki/10202#Documentation EPA ftp site with oil and gas data for the 2016 Version 1 EMP: ftp://newftp.epa.gov/Air/emismod/2016/v1/reports/oilgas/ LADCO Plot Viewer and plots already generated: https://www.ladco.org/technical/modeling-results/2016-inventory- collaborative/ https://www.ladco.org/technical/modeling-results/epa-2016- modeling IWDW Interactive Plotting Tool: http://vibe.cira.colostate.edu/iwdwx/Emissions/2016EMP 13
Calls are at 2 PM Eastern on Second Thursday of each month If you are not already on the list, e-mail michael.ege@tceq.texas.gov to be added 14


 Nonpoint NOx Emissions")
 Nonpoint VOC Emissions")