When Analytics Meet Gamification in Online Pedagogy: Insights and Strategies
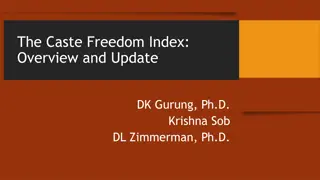
Explore the intersection of analytics and gamification in online pedagogy through case studies and practical examples. Understand the Engagement Index, components, and benefits of this innovative approach to teaching and learning.
Download Presentation

Please find below an Image/Link to download the presentation.
The content on the website is provided AS IS for your information and personal use only. It may not be sold, licensed, or shared on other websites without obtaining consent from the author. If you encounter any issues during the download, it is possible that the publisher has removed the file from their server.
You are allowed to download the files provided on this website for personal or commercial use, subject to the condition that they are used lawfully. All files are the property of their respective owners.
The content on the website is provided AS IS for your information and personal use only. It may not be sold, licensed, or shared on other websites without obtaining consent from the author.
E N D
Presentation Transcript
When Analytics Meet Gamification: The Pedagogy Scott Friese, Assistant Director of Instructional Design, UCOP, @scfriese Greg Niemeyer, Professor for New Media, UC Berkeley, @gregniemeyer Mike Wood, Assistant Director Learning Technology Platforms, UCOP and MacKenzie Alessi, Undergraduate Research Assistant, UC Berkeley
Reciprocal Validation +1 +1
Components of the Engagement Index Leader Board Gallery Weekly Missions Submit Comment +1/-1 Content Point Config
Points Configuration Give a comment: 5 points Get a comment: 3 points Give a +1: 1 point Get a +1: 1 point Give a -1: -1 point Get a -1: -1 point
Points Configuration Give a comment: 5 points Get a comment: 3 points Give a +1: 1 point Get a +1: 1 point Give a -1: -1 point Get a -1: -1 point Got it? +1 point
Data Arts: Weekly Missions Visualize a data concept such as Diffusion Post work in gallery Peer-to-Peer evaluation and feedback Example: Yearning to Breathe Free 22 Comments = 66 points, 46 more than the mission itself
Whom Would You Hire? Ettie Gisela Abigail URL: http://www.polartide.org/bluedome/aei.html
No Correlation between total EI and Final Exam Ettie Gisela Abigail n = 38, R= -0.056119422 URL: http://www.polartide.org/bluedome/EIandExam.html
No Correlation between Mission Points and Final Exam Ettie Gisela Abigail R= 0.05345151 URL: http://www.polartide.org/bluedome/exam_prompted.html
No Correlation between Social Points and Final Exam Ettie Gisela Abigail R= -0.0270024 URL: http://www.polartide.org/bluedome/exam_social.html
Strong Correlation between Social Points and Mission Points Ettie Gisela Abigail n = 38 R= 0.71836433 URL: http://www.polartide.org/bluedome/social_prompted.html
Point by Type View: Cindie Adds a Comment Ettie Receives a Comment Receives a Like Gisela Submissions Adds to Discussion Abigail Adds a Like URL: http://www.polartide.org/bluedome/cindie.html
Point by Type View: Morgan Adds a Like Receives a Comment Receives a Like Submissions Adds a Comment Adds to Discussion URL: http://www.polartide.org/bluedome/morgan.html
Its all about Collaboration Submission Gets a Comment Adds a Comment Gets a Like Adds to Discussion Adds a Like URL: http://www.polartide.org/bluedome/type_percentages.html
Whats next for EI? Deployment for residential courses Beta testers contact: michael.wood@ucop.edu Dataset available More at 4PM on Thursday in The Brainstorming Space
Greg Niemeyer niemeyer@berkeley.edu Mike Wood Scott Friese scott.friese@ucop.edu michael.wood@ucop.edu

